For Jack’s favorite late-round RB targets, click in our Draft Kit here.
Fantasy football is often compared to the stock market. Many of the same concepts apply — buying low, selling high, diversifying your portfolio. But there’s one major difference between them.
If you invest in a stock and it goes up, that’s a win. Even if it only increases a little bit, that’s still money in your pocket. In fantasy football, it’s all or nothing. In most leagues, getting fourth place is the same as finishing last. That’s one reason a player can outperform ADP and still be a disappointment. For example, Josh Jacobs’ ADP was RB10 last year. He finished as the RB9 but posted just a 7.9% win rate — below the expected win rate of 8.3%. Kenyan Drake’s ADP was RB12. He finished exactly as the RB12 but had a pretty bad win rate of 7.0%.
You aren’t looking for players who will outperform ADP; you’re looking for players who can smash it. Those are the guys who actually move the needle on winning a championship.
With that in mind, let me pose a question: Does James White have upside? More broadly, how do you define upside? And how do you know you’re right?
We have a preconceived notion about a player’s upside based on a scenario we create in our heads. If Christian McCaffrey gets hurt, Chuba Hubbard ascends into RB1 territory. Therefore, Hubbard has immense upside. Right?
White will never be a three-down running back. If Damien Harris gets hurt, it’s not like White steps into a workhorse role. Does that mean he lacks upside?
My answer: I think White has upside at his RB56 ADP. Let’s get into why that is.
REDEFINING UPSIDE
In the last six years, 272 RBs had a best ball ADP outside of the first 10 rounds (min. 200 drafts). Eight of them finished as a top-12 RB on a per-game basis (2.9%). 13 finished in the top 24 (4.8%). Think about that for a second: Since 2015, only 13 RBs drafted outside the first 10 rounds have been an RB2 or better on a per-game basis.
You might think this is an argument against Zero RB, but wide receivers don’t fare any better. Over the same span, 360 WRs had an ADP outside the first 10 rounds. Just two of them finished as a WR1 by PPG (0.6%), 19 placed in the top 24 (5.3%), and 46 ranked in the top 36 (12.8%). To keep things simple, we’re going to focus on RBs today, but I’m just pointing this out to illustrate the idea applies across positions.
We can actually quantify upside by looking at different percentile scoring outcomes relative to cost. The graph below uses quantile regression to estimate a 50th, 75th, and 90th percentile outcome by ADP for RBs in PPR formats.
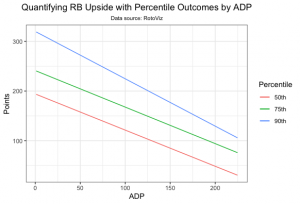
Especially near the end of drafts, a RB doesn’t need to score very much to achieve a high-end outcome. When debating a RB’s upside, we shouldn’t be asking ourselves whether a player can finish as an RB1. We shouldn’t be asking whether a player has every-down potential. We should be asking whether he can cross the blue line in the graph above. Keep in mind I’m using PPR data, so the lines would move down for a half-PPR format like Underdog.
Over the last six years, a top-12 finish has been a top-three percentile outcome for both late-round RBs and WRs. Even a top-24 finish is highly unlikely. It’s possible, but the probability of hitting on those guys is so low that it’s probably -EV to focus on it. In other words, our definition of upside isn’t price-sensitive enough.
THE VALUE OF USABILITY
We know it’s unrealistic to shoot for a top-12 season with late-round RBs. We’ve quantified upside using historical data. What should we look for to increase our chances of finding those high-end outcomes? To answer that, we can look at the most successful late-round RBs by win rate since 2015.
| Player | Year | ADP | Win Rate |
|---|---|---|---|
| James Conner | 2018 | 200.0 | 22.1% |
| Alvin Kamara | 2017 | 137.3 | 20.8% |
| James Robinson | 2020 | 172.3 | 20.4% |
| DeAngelo Williams | 2015 | 169.6 | 16.6% |
| Jordan Howard | 2016 | 170.4 | 15.0% |
| Chris Thompson | 2017 | 180.7 | 15.0% |
| Nyheim Hines | 2020 | 152.9 | 14.3% |
| Jerick McKinnon | 2017 | 168.7 | 13.3% |
| Rex Burkhead | 2020 | 221.2 | 12.7% |
| Chase Edmonds | 2020 | 136.9 | 12.7% |
Only two of those players — Jerick McKinnon and Jordan Howard — didn’t have a surefire role in their first active game. DeAngelo Williams was also locked into a backup job once Le’Veon Bell returned from suspension, although fantasy players still knew they’d get two weeks with an RB1 workload out of him. Howard ascended in Week 2 without an injury to the guy ahead of him, making McKinnon and Williams the only true handcuffs on the list.
Most of these players weren’t three-down RBs either. More than half of them — McKinnon, Alvin Kamara, Chris Thompson, Nyheim Hines, Rex Burkhead, and Chase Edmonds — were mostly used as pass-catchers. Theoretically, a RB lacks upside if he doesn’t have a path to an every-down role. In practice, it doesn’t work like that. Late in drafts, we’re looking for players with the upside to contribute rather than the upside to finish as an RB1.
Howard, James Conner, and James Robinson were workhorses, but they all contributed right away. To be fair, Conner benefited from Bell’s holdout, but the point remains that you’re better off targeting RBs with a Week 1 role rather than waiting for an injury.
If you’re not a fan of win rates (they can be noisy), we can also look at the RBs who most exceeded ADP-based expectations. Basically, we can predict how many points a RB will score based on how guys with similar ADPs performed in the past.
Let’s look at the 10 most successful late-round RBs over the last six years using this method.
| Player | Year | ADP | Points Over Expected |
|---|---|---|---|
| James Conner | 2018 | 200.0 | 206.9 |
| Alvin Kamara | 2017 | 137.3 | 189.9 |
| James Robinson | 2020 | 172.3 | 167.4 |
| DeAngelo Williams | 2015 | 169.6 | 144.5 |
| Jordan Howard | 2016 | 170.4 | 132.4 |
| LeGarrette Blount | 2016 | 134.6 | 121.3 |
| Spencer Ware | 2016 | 178.2 | 118.7 |
| Javorius Allen | 2017 | 222.0 | 117.2 |
| T.J. Yeldon | 2018 | 195.2 | 106.6 |
| James Starks | 2015 | 204.8 | 104.4 |
The first five names were also on the first list. The other five are new. Two of these guys — Spencer Ware and T.J. Yeldon — broke out because the RB in front of them got hurt. However, Ware was the Chiefs’ Week 1 starter because Jamaal Charles missed the beginning of the season due to injury. Charles reaggravated his injury when he returned and missed the rest of the year. In that sense, Ware is a special case because his ADP spiked once it became apparent Charles wouldn’t be ready for Week 1.
As for the remaining three: LeGarrette Blount had 299 carries and scored 18 TDs, but he had just eight targets. Meanwhile, White and Dion Lewis combined for 110. Javorius Allen split work in both facets with Terrance West for the entire 2017 season. James Starks was helped by Eddie Lacy‘s tumultuous 2015 campaign. Although Lacy got dinged up here and there, he played 15 games and shared snaps with Starks pretty evenly.
Using both lists together, it’s clear that most high-end outcomes don’t come as a result of injury. You don’t need an every-down workload to smash ADP either. Both lists were littered with pass-catching RBs who had no path to a workhorse role.
It’s also important to remember we’re talking about best ball here. In managed leagues, a player who has RB1 potential but doesn’t contribute weekly is more valuable because you can find contributors on the waiver wire. In best ball, it’s suboptimal to take a zero every week just because you think a guy has potential. And it’s not like we’re only targeting floor here — some of the guys in the tables above were RB1s. We just want RBs who will have usable weeks independent of what happens to other players.
I recently wrote an article for RotoViz that used a different methodology to arrive at a similar conclusion. Basically, we can take the top-two RBs by ADP on each team and group each player based on where they’re getting drafted relative to their teammate. For example, McCaffrey’s Underdog ADP is 180.4 spots ahead of Hubbard’s. That’s a massive gap. On the other hand, Phillip Lindsay — the RB directly in front of Hubbard by ADP — is only going 53.4 spots behind David Johnson. From 2015-20, the average gap between a team’s RB1 and RB2 was 98.5 spots. RB2s with a below-average gap (i.e. mostly RB2s in a committee) averaged an 8.6% win rate, whereas those with an above-average gap (i.e. handcuffs) won 8.3% of the time.
| RB Type | ADP | Points | Win Rate | Hit Rate |
|---|---|---|---|---|
| Committee RB2 | 106.6 | 115.2 | 8.6% | 38.0% |
| Handcuff | 178.9 | 80.7 | 8.3% | 39.8% |
It’s worth mentioning Conner and his 22.1% win rate in 2018 are in the latter group, even though his ADP varied dramatically based on what month it was and how much information we had about Bell’s holdout. If you remove him, the average win rate for handcuffs drops to 8.1%.
A player with a clear path to usability has 17 chances to crack your lineup. While he may not be adding many points each week, those small contributions add up. Furthermore, players with usable weeks have the same chance as anyone else to benefit from the chaos of an NFL season. Lindsay’s stock increases drastically if Johnson goes down. Not as much as Hubbard’s would in the event of a McCaffrey injury, but it’s still something. And the data clearly demonstrates the value of usability outweighs the ever-so-slight possibility of an RB1 season.
We also tend to be overconfident in predicting who benefits or how much a player benefits from said chaos. Last year, Reggie Bonnafon was picked in six times as many drafts as Mike Davis, but it was the latter who took over after McCaffrey got hurt. When Dalvin Cook went down, Alexander Mattison ceded pass-catching work to Ameer Abdullah. Things don’t always turn out like we think they will.
PUTTING IT ALL TOGETHER
Upside is important, but we aren’t price-sensitive enough when defining it. In the final rounds, upside shouldn’t be about the possibility of a player finishing among the elites. That’s an unrealistic standard that will cause you to donate points in favor of a player who may never see the field. Rather, we should look for players with a realistic chance of posting a high-end season relative to ADP — using historical data to define what “high-end season relative to ADP” means.
Back to James White. He doesn’t have three-down potential. He probably won’t finish as an RB1 (although he did finish as the RB10 by PPG in half-PPR two years ago!). However, he does have a Week 1 role and a massive target ceiling, especially if Mac Jones gets significant playing time. I mean, he had the third-highest target share among all RBs in 2020. While your opponents are chasing a theoretical RB1 ceiling, you should approach drafts with a price-sensitive definition of upside.