DraftKings and FanDuel’s single-game showdown format has continued to grow rapidly after they were introduced a few seasons ago. Since the format’s inception, I’ve been compiling a database of every lineup entered in the DraftKings flagship GPP to get a better understanding of what our opponents are doing compared to what’s actually winning. Heading into the 2022 season, we can leverage this information to create more profitable tournament lineups.
Captain Selection
The biggest differences between the traditional fantasy formats we’re all accustomed to and showdown are the introductions of complete positional flexibility and the addition of a Captain roster spot. On DraftKings, the Captain position scores 1.5x the standard fantasy-point value for each statistic but will also cost 1.5x more salary than if they’re rostered in the FLEX. Given its significance, selecting the right CPT becomes the foundation upon which the remainder of our lineup will be built.
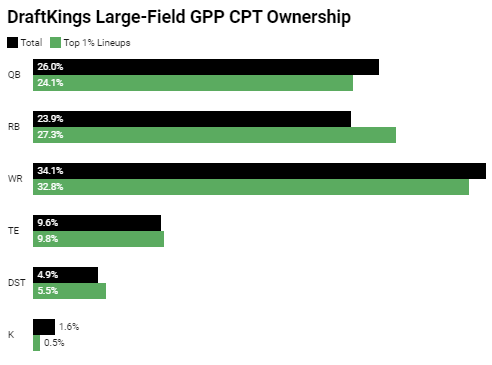
At least at the positional level, the field is making very few mistakes when selecting their CPT. As you can see above, each position is rostered virtually as often as it appears in top-1% finishing lineups, with few instances where a single position is over- or under-owned relative to how often they’re optimal.
By process of elimination, we can start to whittle down the 30+ player pool into a succinct group of options that have the ceiling to finish as the slate’s optimal CPT. We can start by removing kickers, given the unlikelihood that they’ll propel our lineups to the top of the leaderboards as our Captain. Particularly in contests where salary is at a premium and expensive skill-position players are plentiful, a strong median projection on a sub-$4,000 kicker can result in them finding their way into the CPT spot more often than they should. Look no further than last year’s Super Bowl where Evan McPherson’s ($4,000) 8.1 DraftKings-point projection led to 2.7% CPT ownership as a way for the field to fit Cooper Kupp ($11,600), Ja’Marr Chase ($10,400), and Co. In these spots, I’d rather remove them from my CPT player pool entirely.
Similarly, though CPT D/ST has outperformed the field’s expectation over the previous two seasons, I rarely target defenses for my Captain spot. Our collective inability to accurately project D/ST performance has been on display in classic contests for years and we haven’t suddenly improved with the introduction of showdown. Since 2020, the r-squared between CPT D/ST ownership and CPT D/ST DraftKings points is a meager .09. In other words, there’s virtually no relationship between increased ownership and fantasy production. Because D/ST scoring is so volatile and we’re generally unable to identify outliers, the best time to use this position at CPT is when it won’t come with ownership.
The dismissal of both the kicker and D/ST positions will leave us mostly exposed to the four offensive options that have accounted for 94.0% of the CPT selections in top-1% finishing lineups since 2020, led by wide receivers soaking up a whopping 32.8% exposure. Running backs present the largest delta between winning lineups and the rest of the field, as 27.3% of top-1% finishing lineups were anchored with CPT RB compared to just 23.9% of the field. Even on PPR-friendly sites like DraftKings, bellcow back ceilings offer slate-winning upside. CPT QBs have been rostered slightly more often than they’ve been optimal in the past, but they are still represented in 24.1% of top-1% lineups.
Now that we know how to attack our Captain spot positionally, we can further subset our player pool by looking at salary, ownership, player archetype, and Vegas data. Being mindful of these additional variables will help strengthen our CPT player pool for each slate.
Using Vegas information at its most basic level, we can see the field is rostering favorites at CPT (62.3%) at a virtually identical rate as top-1% lineups (61.7%). Of course, players from teams that are favored are likely to score more fantasy points, but can we learn more about our opponents’ tendencies as we dig further into spreads and game totals?
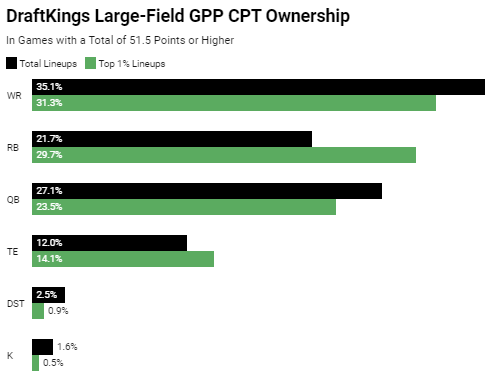
Since 2018, average NFL game totals have hovered around 46.5 points. That means we can consider games that have a total north of 51, or at least one standard deviation above average, high-scoring. Conversely, games with a total shy of 42, or one standard deviation below average, could be considered low-scoring. Using historical contest data, we can see how ownership, and results, shift by total. In projected high-scoring game environments, we see wide receivers remain king, accounting for 31.3% of the CPT ownership for all top-1% finishing lineups. However, it’s the running back group that once again provides the biggest delta between field exposure and top-1% exposure. If a game matches or exceeds an already lofty total, running backs are more likely to be optimal Captains as a result.
Similarly, we can see how the field’s CPT usage changes based on spreads. The average closing spread for NFL games since 2003 is 5.3 points. Let’s look at CPT usage in games with a spread at least one standard deviation higher than average and identify possible Captain options in games that are more likely to be a blowout with closing lines of 9 or greater.
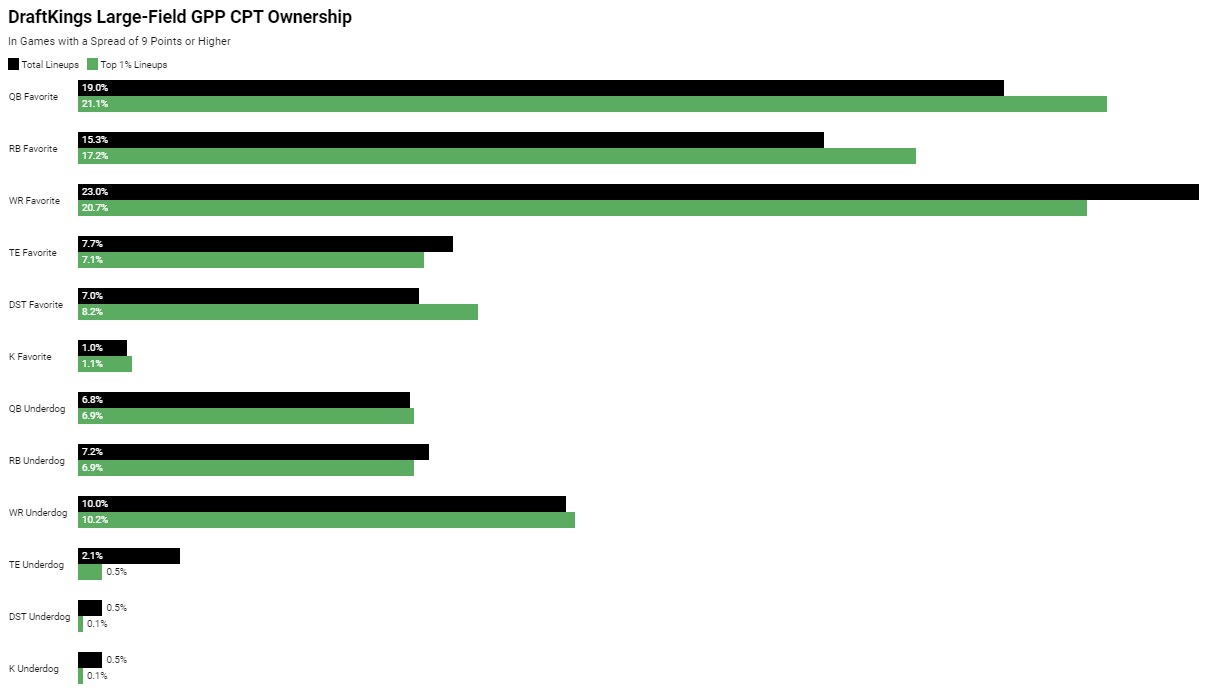
In games with a closing spread of at least 9 points, Captains from the favored team accounted for 75.4% of the exposure on top-1% lineups. Unsurprisingly, underdog wide receivers were most likely to overcome the scoreboard disadvantage, thanks in part to the DraftKings scoring format, finding their way into the CPT spot of top-1% lineups at a 10.2% clip. It’s worth noting that lineups that rostered an underdog CPT in games with a spread of at least 9 points were 39.9% less duplicated on average.
As a result of the 1.5x salary multiplier for the Captain position, one of the most common misconceptions I encounter with showdown is the idea that we can simply roster a strong pt/$ value at CPT in order to fit more expensive options in the FLEX. In large-field tournaments, our focus should be less on the top value and more on the top overall scorer. As a result, options at the top end of the salary range are going to make up a majority of our CPT player pool. The average Captain salary in top-1% lineups since 2020 is $13,012, boasting an average ETR CPT projection of 23.6 DraftKings points.
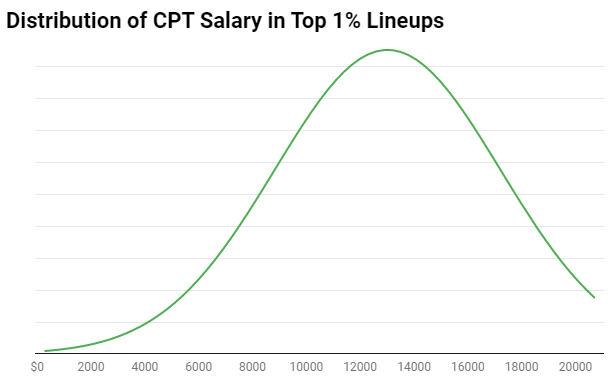
Even when Captains at the lower end of the salary spectrum finish in winning lineups, it isn’t enough for them to simply reach ‘value’. Players priced $7,500 and below that finished in top-1% lineups, for example, beat their median CPT projection (9.9) by more than 2.6x, scoring 26.4 DraftKings points on average. If we choose to spend down, it should be for a player with paths to not only beating their median projection but also challenging the slate’s most expensive options for the top overall scorer crown.
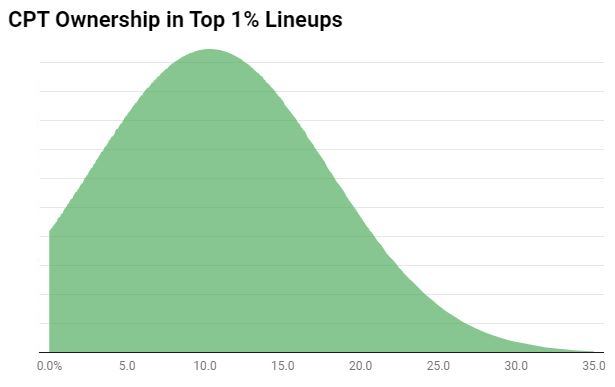
Just as we shouldn’t be surprised to see the slate’s most expensive players finish as the optimal CPT more often than their bargain-bin counterparts, it’s no shock to see higher-owned CPTs frequently finding themselves in top-1% finishing lineups. The average CPT ownership for winning lineups is a healthy 10.3%, suggesting there’s little need to stray too far from the field when constructing our CPT player pool. More importantly, there’s minimal correlation between CPT ownership and the number of duplicates. In other words, as long as you’re being mindful of the remainder of your roster construction, a popular CPT by itself isn’t likely to result in heavily duplicated lineups.
Correlation
Now that we have a firm grasp on how to attack the CPT position, it’s important we take time to understand how to properly construct the remainder of our lineups around the format’s most important roster spot.
Appearing in 32.8% of top-1% lineups, CPT WRs have been a consistent theme in winning lineups in recent years. We can understand how to optimally play CPT WR by reviewing historical data.
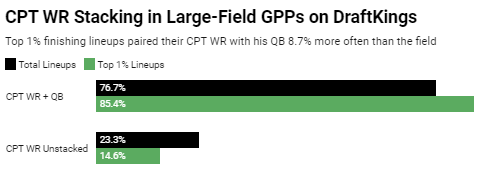
This one also seems rather intuitive, but whether it be due to user error with optimizers or as an intentional way to get unique, the field is not pairing their CPT WR with his QB at a high enough rate. While we should most often be stacking CPT WR + QB, there are a few instances where avoiding it can result in winning lineups. Look no further than last year’s Super Bowl, where CPT Tee Higgins without Joe Burrow took home top honors with just ten duplicates. The $7,600 price tag on Higgins and his proximity in DraftKings scoring to top overall scorer Cooper Kupp ($11,600) propelled the unstacked Higgins lineup above the CPT Kupp + Matthew Stafford teams that finished 1.35 points short.
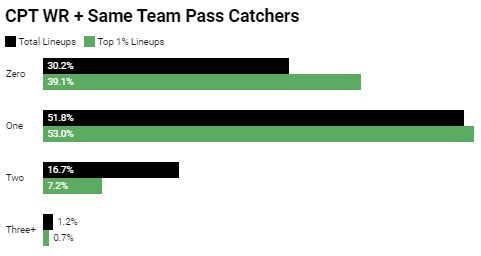
Another fairly straightforward concept that remains underutilized by the field, is when rostering a wide receiver at Captain, we should most often pair them with fewer than two additional pass catchers from their team. If a wide receiver produces a slate-winning score, it’s less likely multiple teammates can do enough to also find winning lineups.
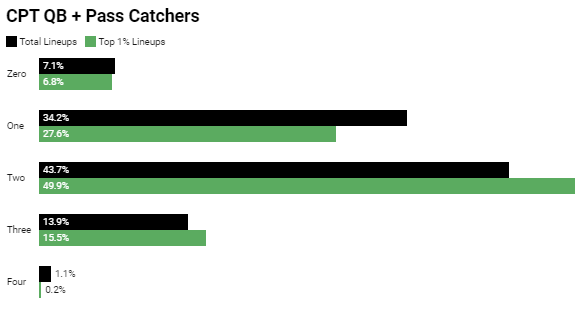
The field has also lagged on double stacking with their CPT QB. Outside of quarterbacks who capture some of their ceiling with rushing upside, rostering just one pass catcher with CPT QB introduces a scenario where we need a majority of the receiving production to funnel to our lone receiver, but not so much so that he outscores his QB. By including two or even three pass catchers, we’re expecting the production to be more evenly distributed in a way that will result in our CPT QB outscoring his pass-catching corps as a whole.
With some of the basic correlations out of the way, we can begin to explore more micro player pairings and how groupings can increase — or decrease — our expected win rate. An often overlooked aspect of showdown lineup constructions, kickers have landed in top-1% finishing lineups at a 33.7% clip. However, when we roster a CPT QB, the kicker from his team lands in top-1% lineups at just a 19.2% rate. Because we need our CPT QB to score touchdowns and our FLEX kicker to hit field goals, we cannibalize some of our upside by rostering them together.
What about pairings that are negatively correlated, such as CPT QB + Opposing D/ST? The field has been basically correct in avoiding a Captain from one team vs. the opposing defense, rostering this grouping at a 6.1% clip compared to 5.4% for top-1% finishers. However, of the 5.4% that successfully pulled off the negative correlation, they were rewarded with lineups that were duplicated 5.6x on average compared to 15.7x for all other top-1% lineups. Given the increased likelihood that lineups featuring these types of pairings are unique, I try not to actively group them out.
Being Unique
Up to this point, our focus has been on building the best lineups possible with minimal attention paid to ensuring our lineup is not duplicated. Unlike classic slates where there are hundreds of legitimate players to roster each week, single-game contests present an entirely new challenge with at most 30 options on a given slate. Because our lineup’s expected value is directly impacted by how often it is entered by our opponents, it’s important to build teams that not only have paths to tournament-winning upside but are unique once there.
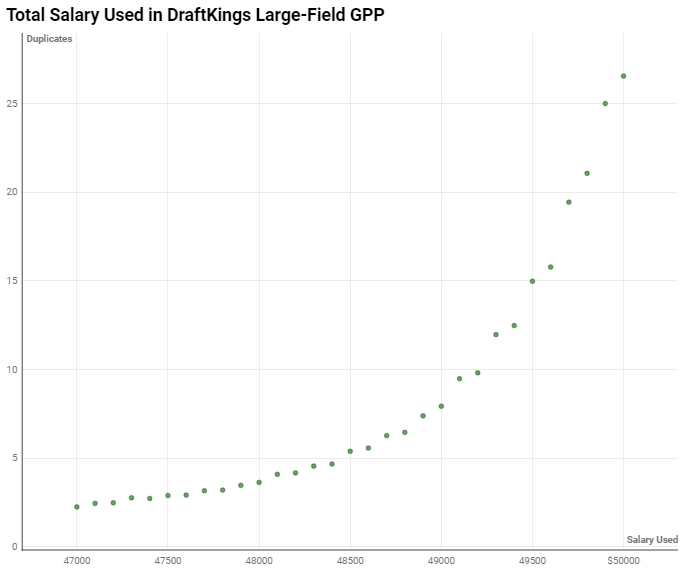
Whether you’re using an optimizer or sitting on a toilet building by hand, one of the easiest ways to reduce the number of expected duplicates is to limit the total salary of your lineup. Executed quickly by setting a max spend on the optimizer or simply viewing the salary remaining on the DraftKings app, reducing our overall salary spent has shown a positive correlation with fewer duplicates. As with most topics discussed in this article, salary spent should be adjusted on a slate-by-slate basis, and I don’t recommend setting hard-and-fast rules for each showdown slate.
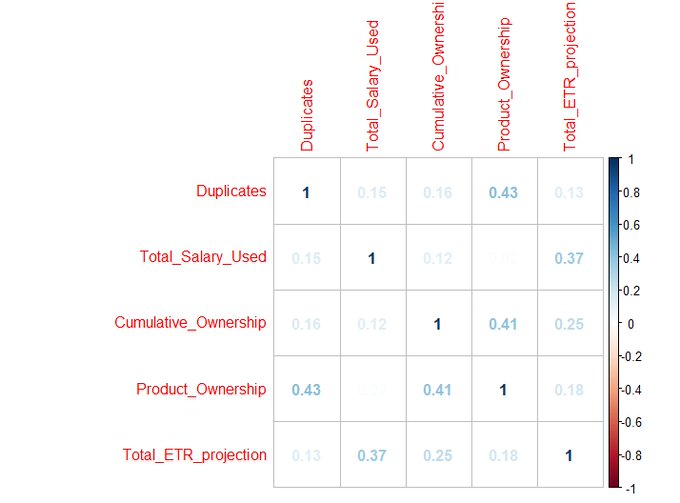
While cumulative ownership gets the spotlight and is easier to manipulate for those using optimizers, reducing our product ownership has proven more useful in attempting to limit duplicate lineups. Just as we can calculate our lineup’s cumulative ownership by adding up the ownership of each individual roster spot, product ownership can be found by multiplying each spot. As an extreme example, a two-player pairing that consists of 20% owned Kyler Murray + 20% owned Zach Ertz is far more likely to be duplicated than 39% owned DeAndre Hopkins + 1% owned Eno Benjamin despite identical 40% cumulative ownership. Since most optimizers aren’t designed to help us limit our product ownership, we’re best served setting groups or rules to include ‘at least one player sub-x% ownership’ in our large-field GPP lineups, though we should approach this on a slate-by-slate basis and avoid rigid rules. The .43 r-squared between product ownership and the number of duplicates is the highest correlation of any single variable that I’ve tracked. When we can lower our lineup’s product ownership without making significant sacrifices to our lineup’s projection, we drastically increase our lineup’s expected value.
While understanding correlation and how it impacts roster construction is an important component to being successful at showdown, football is a high-variance sport and the event-based scoring of this format will often produce winning lineups that seem counterintuitive. Those ‘random’ lineups that appear to ignore correlation or even embrace anticorrelation are generally rewarded with fewer duplicates. We can look at a few pairings to see how expected duplicates are impacted when certain players are, or aren’t, rostered together and determine how that might affect the rest of our roster construction.
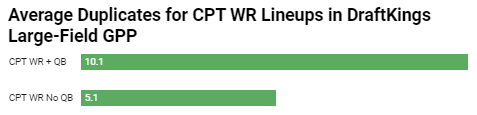
Remember that note from the correlation section where I suggested the field still wasn’t stacking their CPT WR with his QB enough in large-field tournaments? I still agree with that, but this illustrates that when we do complete the CPT WR + QB stack, our expected duplicates increase from 5.1 to 10.1 vs. non-stacked lineups. In lineups that have two or more players who are more likely to be owned together, we need to be even more aggressive in limiting our product ownership, salary, etc. Conversely, if we’re actively avoiding the CPT WR + QB combo, we’ve already taken a significant step in lowering our expected dupes and can instead include players with higher projected ownership or use more of our total salary.
Similarly, lineups that rostered two running backs from the same team were duplicated on average 6.6x compared to 8.5x for lineups that rostered just one. While there are countless examples of inversely or weakly correlated player combinations we could examine here, let these two serve as a reminder that cumulative and product ownership numbers are not created equal. We should always go one step further to try and determine how often certain combos are rostered together and how that changes what else we need to do to be unique.
Just as inversely correlated player pairings can improve our chances of being unique, roster constructions that are heavily weighted in favor of one team, typically underdogs, have consistently been underutilized by the field and offer significant positive leverage. While 2-4 roster constructions still offer the most leverage, utilized by just 16.1% of the field on average, even 5-1 builds have been used less often than they’ve won.
Groups and Rules to Consider
I steer clear of rigid rules and groups when optimizing showdown lineups, not only because of the inherent randomness of a single NFL game, but also because the rules that are required to create +EV lineups are fluid based on all of the variables discussed above that impact a single lineup’s usability. With that in mind, I’ll share a few that I consider on most slates that I think can provide guardrails for better long-term roster construction.
Max (2) K & D/ST in the same lineup:
The combination of cheap salary and fair median projection for kickers and defenses as a whole makes it more likely that optimizers will force them into lineups, particularly when the skill-position players they’re priced around project poorly. Don’t let the strong median projection fool you; 3+ kickers and/or D/ST have landed in top-1% finishing lineups at a paltry 1.1% rate.
Max (1) WR/TE from the same team as CPT WR:
As noted above, just 7.9% of top-1% finishing lineups rostered more than (1) additional WR or TE in FLEX with a CPT WR from the same team. While I understand I’ll miss outlier situations where CPT WR + two pass catchers are optimal, I think there are diminishing returns when including pass catchers in the flex of CPT WR teams, because it becomes more likely that team’s QB is the optimal CPT as you add more pass catchers.
If rostering a D/ST, max (3) players from the opposing team:
You could easily extend this to four players from the opposing team when rostering a D/ST, but 88.8% of top-1% lineups have paired their D/ST with three or fewer players from the opposing team. Exceptions can be made, but in lineups with a D/ST, I’m most likely restricting my exposure to the opposing team to three players.