
What one thing could improve the experience of live-tweeting every single NFL island game alongside millions of your closest friends? Sweating a high-variance, lottery-style DFS product that rewards the most contrarian approaches, of course!
Showdown contests have soared in popularity with both DraftKings and FanDuel offering anywhere from six-figure to million-dollar payouts to winners for each NFL primetime island game. As the industry focused more attention on the format, the field got sharper and made fewer mistakes in 2020. In this article, we’ll take a 101-level look at last year’s data and identify the best ways to take advantage this season.
POSITION-BY-POSITION BREAKDOWN
Because of the increased roster flexibility, introduction of the captain position, addition of the kicker, and lack of positional requirements, it’s valuable to establish an understanding of how each position performed in 2020 while including factors like median salary and average ownership. By starting here we’ll get a better sense of which groups are top performers and how the field thinks about roster construction. Since we’re working with such a small sample size (53 slates per year), this data is fluid and can change quickly as more information becomes available.
| Position | 2019 Avg Salary | 2020 Avg Salary | 2019 Avg DK Points | 2020 Avg DK Points | 2019 Avg Total Own% | 2020 Avg Total Own% | 2019 Avg Captain Own% | 2020 Avg Captain Own% |
| QB1 |
$10,200
|
$10,900 | 16.75 | 19.73 | 56.95% | 63.46% | 10.98% | 13.04% |
| RB1 |
$8,800
|
$8,700 | 14.22 | 14.92 | 47.25% | 45.02% | 11.05% | 11.38% |
| RB2 |
$4,400
|
$3,800 | 7.76 | 7.92 | 18.42% | 19.82% | 2.82% | 2.53% |
| WR1 |
$9,400
|
$9,100 | 13.94 | 13.9 | 44.68% | 42.30% | 8.57% | 8.40% |
| WR2 |
$6,600
|
$6,800 | 10.09 | 11.62 | 28.49% | 31.69% | 4.02% | 4.88% |
| TE1 |
$5,500
|
$6,400 | 8.62 | 10.55 | 27.37% | 28.00% | 3.69% | 4.17% |
| K |
$3,700
|
$3,900 | 7.27 | 7.32 | 22.32% | 17.59% | 0.94% | 0.81% |
| DST |
$4,100
|
$3,800 | 7.41 | 5.54 | 20.69% | 12.93% |
4.58%
|
2.54% |
Quarterbacks: Unsurprisingly, QBs lead the player pool in average salary, ownership, and fantasy production. They often provide the safest floor and as necessary members of any pass game stacks, ownership is naturally driven up. Notably, we saw the field increase their ownership of quarterbacks in 2020, likely as a result of the influx of rushing upside at the position. A whopping 92% of all showdown lineups rostered at least one QB, which seems extreme until you realize that 96% of top 1% lineups did the same.
Running Backs/Wide Receivers: In this format, WRs own the widest range of outcomes followed closely by RBs. The correlation between game script and volume creates an opportunity for us to take advantage of a potential ownership discount in spots where we think a game plays out a certain way and the field disagrees. In 2020, the field was basically correct in their use of wide receivers at CPT; 33% of all lineups embraced the variance, while 31.4% of top 1% lineups opted to go that route.
Tight Ends: Despite being a relative dumpster fire in 2020, showdown tight ends saw their average salary increase by 16% last season. On top of that, their average ownership stayed relatively flat. They once again fall in a no man’s land between the better pt/$ options in the DST/K below them and the higher-upside RB/WR above them.
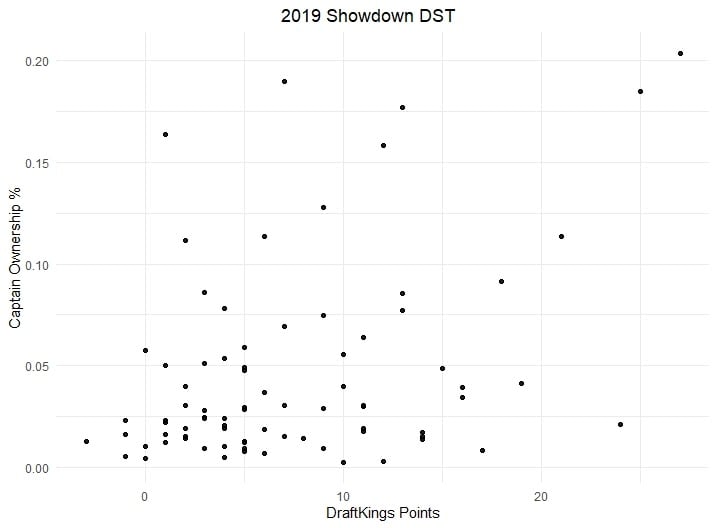
D/ST: As Adam noted in his How to Win DraftKings Milly Maker article, the field was generally pretty poor at predicting D/ST scoring last season, with just a .25 correlation between DraftKings points and ownership. As you can see below, the field hasn’t been much better at identifying outlier D/ST performances in showdown contests. Notably, DST salary ($3,800) and ownership (12.93%) were up 7% from last year. If that trend continues, we may find spots to get cheap, low-owned defenses into our lineups this season.
Kickers: Ignoring the introduction of the captain position, adding kickers to the player pool is among the biggest wrinkles in this format. They will routinely project among the top pt/$ plays and frequently outscore players in the same price range. In 2019, skill position players priced between $2600-$4200 averaged just 4.55 DraftKings points at 12.77% ownership. Because kickers have such a tight range of outcomes and are inherently underpriced in these contests, they often become essential pieces of winning lineups when the cheap options around them fail to produce outlier performances. The biggest change from 2019 to 2020 was the average increase in kicker salary. Though it jumped just 5% ($3700 to $3900), it was enough to also reduce ownership by 5% and create scenarios where WR3/RB2 type players forced their way into optimal lineups.
Top Captain By Position:
Hardly surprised by the success rate of each position, wide receivers remain king as they were the captain in a whopping 31.4% of top 1% finishing lineups last season. Given DraftKings’ PPR-friendly scoring and the direction of the league as a whole, it’s a trend I expect to continue this season.
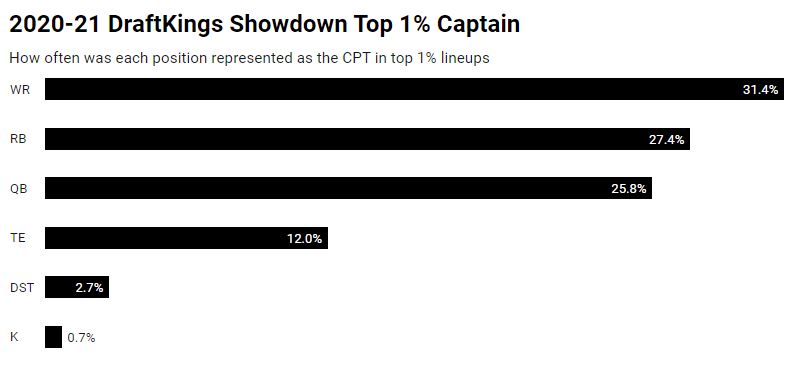
We can largely ignore DST/K in our captain spot. As noted above, outlier D/ST performances are difficult to predict, and when we think we’ve identified a ‘good spot’, the field will likely greet us with higher-than-expected captain ownership. In large-field tournaments, it’s acceptable to remove them from our captain player pool to avoid lineups where their high pt/$ projection forces them into our lineups as captains.
The Field Is Good At Identifying Top Captain Options
The correlation between captain ownership and DraftKings points (.60) remains strong for the field, a solid indicator that they’re generally on the right track when it comes to selecting the correct captain. This is an important reminder for us not to outsmart ourselves chasing sub-5% owned dart throws, given the likelihood that the slate’s top projected players will finish atop leaderboards. If you’re struggling with constructing unique lineups while playing more popular captains, visit this article for suggestions.
Don’t Ignore Vegas Data
The data showed that 57% of top 1% lineups used a Vegas favorite at captain. This is rather intuitive but worth repeating: Teams that score more points often score more fantasy points.
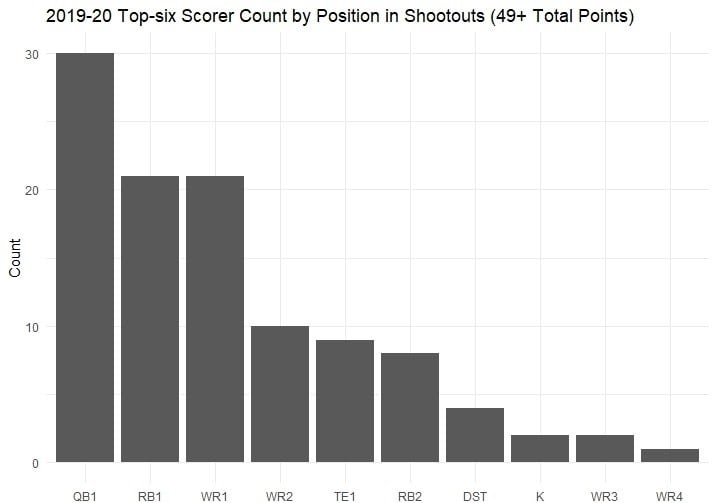
Consider The Game Environment You’re Building For
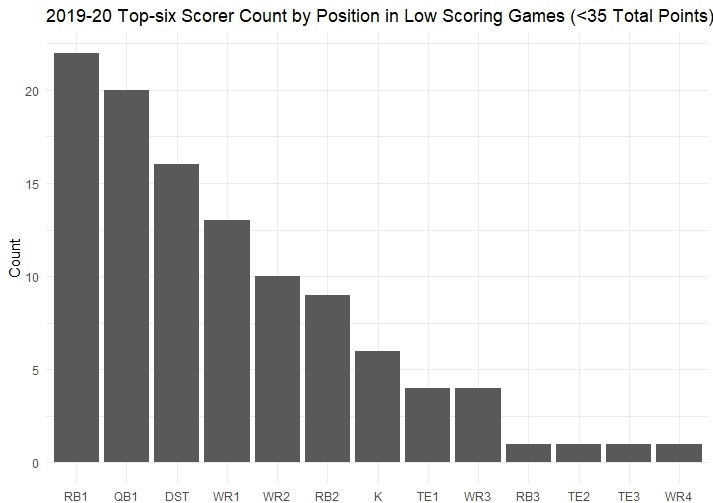
Unlike main slate contests where it can be difficult to project game flow for nearly a dozen games, single-game slates make it easier to overanalyze and build lineups based on how we think the game will be played. Game script correlates strongly with opportunity and is among the most important factors when selecting our pool of potential captains. Let’s take a look at the top scorers by game type from last season:
GROUP SETTINGS & RULES TO CONSIDER
No more than (2) K/DST In The Same Lineup
Rostering more than two Kickers/DST combined resulted in a top 1% finish rate of just 1.1%. On occasion, multiple high pt/$ DST/K will force their way into lineups when stronger options don’t exist. We can avoid too many of them landing in one lineup by setting a ‘max 2’ rule.
Run It Back Stacks
An opposing QB, WR, or TE was included in 88.89% of winning lineups that rostered a QB, WR, or TE from the other team at captain. Set a group to include at least one of these players in such lineups.
Don’t Force Same Team CPT WR/TE-QB Groups
This challenges conventional wisdom where we’ve long assumed that if our pass catcher hits his ceiling, their QB likely does so as well. While we should, as much as possible, build highly correlated lineups around our captain, there are instances where our pass catcher can produce a slate-winning type score without his QB also finishing in the winning lineup and when that happens, we’re more likely to have an unduplicated lineup. With the average QB accounting for nearly 22% of the total salary cap, it’s possible to find scenarios where our CPT WR dominates receiving production and leaves his quarterback on the outside looking in. Generally, we can execute this strategy with teams where a majority of the production is likely to funnel through one receiver. On those slates, we can dedicate a portion (15-20%) of our overall lineup portfolio to this style of build.
No More than (2) ‘Punt’ Options Per Lineup
Defined as the group of players priced between $200-$2000, punt players are a necessary evil to make a majority of lineup constructions work. In a sample of 69,832 lineups that finished in the top 1%, only 7.48% of users rostered more than two players that meet the salary criteria and zero lineups rostered more than two such players. If we’re rostering Patrick Mahomes, even while we are actively trying to be unique, it doesn’t make sense to include Byron Pringle, Demarcus Robinson, and Blake Bell in the same lineup. To avoid cannibalizing our upside if a cheap player produces a slate-winning score, we should set rules to limit no more than two per lineup.
If ‘Player X’ at CPT, Exclude ‘Player Y’
The field struggled with such rules in 2019, rostering CPT QB + Opposing D/ST on nearly 7.8% of all lineups. In 2020 that number fell sharply to 1.4%, highlighting the field’s ability to correct past mistakes. While something like CPT QB + Opposing D/ST is an obvious example of a rule we should set to avoid strong negative correlation, there are other examples to consider on a slate-by-slate basis.
Not All Correlations Are Created Equal
Using FantasyLabs’ Correlations Tool, we see that some of the strongest league-wide correlations are QB-Opposing QB (.57), QB-WR1 (.52) and QB-TE1 (.50), but understanding how production correlates between players of specific teams is important for creating groups in showdown contests. There is no one-size-fits-all answer, rather it’s a tool we can use to force players into the same lineups when we think they perform well together or to avoid players in the same lineups where if one exceeds expectations, the other is unlikely to do so. In some instances, setting a group for no more than one RB from the same team is correct. We would never use Christian McCaffrey and Chuba Hubbard in the same lineup because Hubbard’s value is contingent on an in-game injury to McCaffrey. However, we may be okay with lineups that contain both Raheem Mostert and Trey Sermon. In a 60-40 or 50-50 split, there are paths for both to reach value.
What to Expect from our In-Season Showdown Content in 2021:
*Team and Game Level Trends
*Stack Ideas
*Groups to Consider
*Ownership Projections
*Player Projections