

In Part 1 of this series, we established two things: The post-lock sims are well calibrated at the cash-rate and top-1% level, and max-entry players systematically outperform every other cohort on virtually any metric we can measure with the post-lock sim data at our disposal. They have a higher average sim ROI, higher cash rate, higher top-1% rate, and higher actual ROI, and the gap isn’t particularly close.
We determined in Part 1 whether the sims work and tried to understand where there may be flaws. In Part 2, we’re going to attempt to understand what the “pros” are doing so we can leverage that information in our lineup-building process.
The important distinction to make here is that we aren’t going to focus on what or who won. The Solver’s post-lock sim data only dates back to Week 5 of the 2025 season and gives us a 33-slate sample to draw from. While it’s a growing sample, it’s still too noisy to learn much from, given how much a single slate can distort everything. Instead, we’re going to focus on the subset of players who simply build better lineups than their opponents and ask what they’re doing differently. While single lineup decisions will be a component of this article, the more important question to answer is how the best players are thinking about constructing a portfolio of lineups with the goal of growing their bankroll.
How Pros Build
Before we get into the specifics, it’s worth repeating that this analysis is focused on NFL primetime showdown slates from Week 5 through the Super Bowl of the 2025 season, spanning 33 slates. For those 33 slates, we’ve gathered the post-lock sim data from The Solver for the Wildcat or Field General contests, which are generally between 1,000 and 1,500 total entries with a 37-entry max per user at either a $333 or $444 buy-in.
To highlight the skill gap we’re working with, max-entry (31+ entries in a slate) players averaged +12.0% sim ROI per lineup across our dataset, while players who submitted just a single lineup in those same contests averaged -10.5%. Cash rate (23.1% vs. 21.1%), top-1% rate (1.37% vs. 0.92%), and actual ROI (+8.0% vs. -21.6%) were just as drastic. So what are max-entry players doing at the lineup level that leads to such drastic differences in results?
CPT Selection
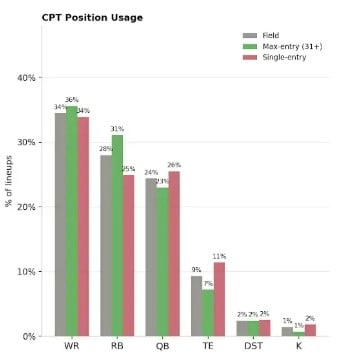
This isn’t our first time reviewing the proper CPT allocation. We’ve reviewed it over multiple seasons in lottery-style contests on DraftKings; we’ve looked at what top-1% finishing lineups do most often; and we’ve looked at what the field is doing to try and identify how we can give ourselves the biggest advantage at the format’s most important roster spot.
Max-entry players use CPT RB in 31.1% of their lineups compared to 24.9% from single-entry players. Max-entry CPT RB lineups average a +8.0% sim ROI, CPT WR +4.5%, CPT QB -3.3%, and CPT TE -12.0%, highlighting an advantage gained over the field simply by dedicating a higher percentage of their lineups to the running back position. Additionally, max-entry players use CPT TE just 7.2% of the time versus 11.4% for single-entry players.
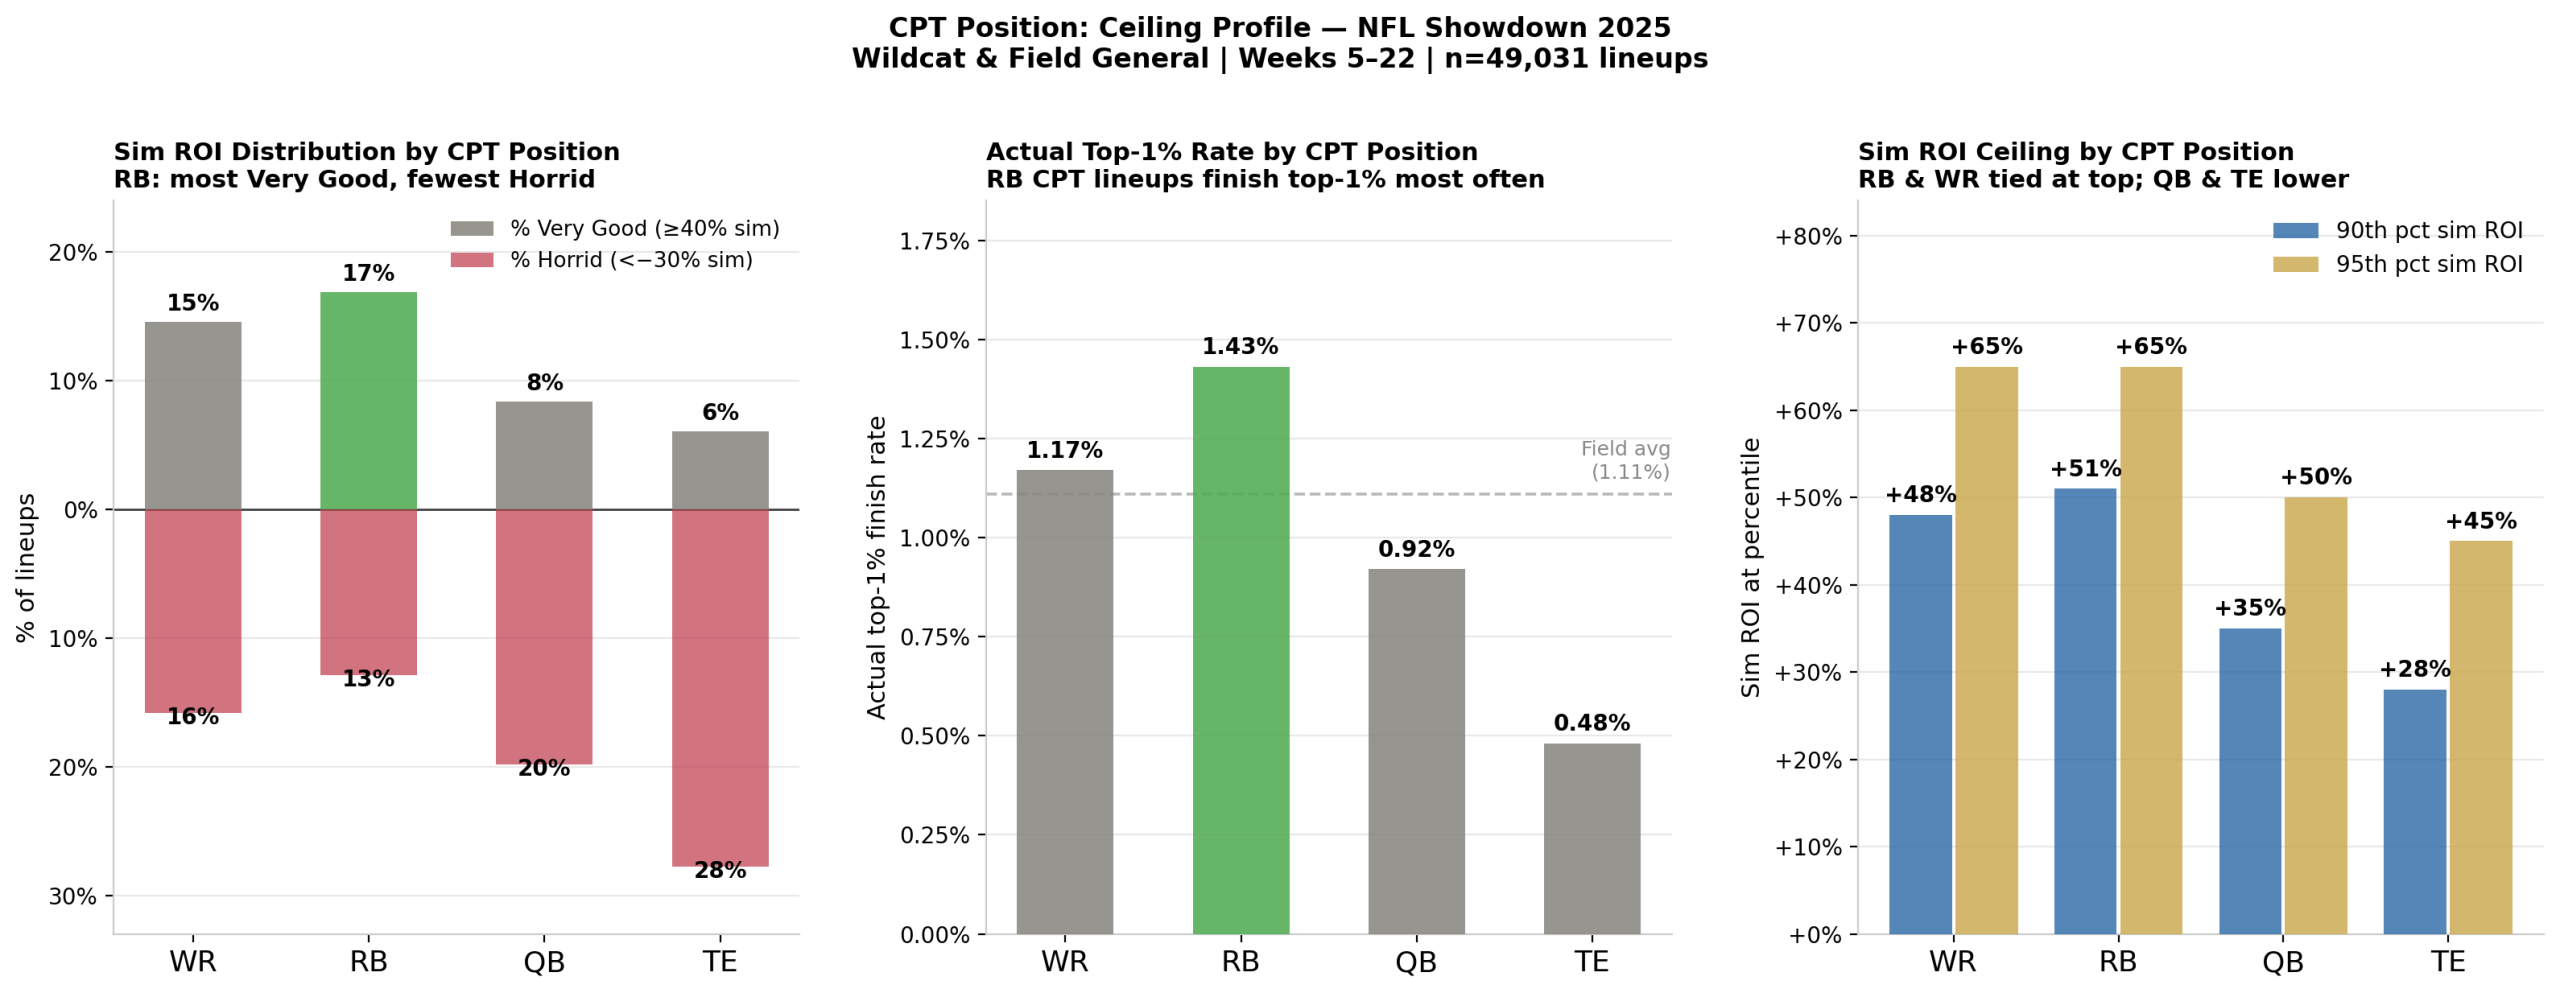
Over the 33 slates in our sample, the actual results followed the sim’s expectations. Across all lineups, CPT RB averaged a +24.8% actual ROI, 24.7% cash rate, and 1.43% top-1% rate, while CPT TE lineups posted a -53.0% actual ROI. Among max-entry players only, CPT RB lineups averaged a +54.7% actual ROI and 1.77% top-1% rate. While those results are merely descriptive and can be heavily influenced by a few outcomes over a relatively small sample, the consistency with what was expected by the sim ROI provides some validation. CPT RB is more consistently assigned a positive post-lock sim ROI and is more frequently used by max-entry players than their lower-volume counterparts. So why do the sims like CPT RB?
The answer is nuanced, but we can make some assumptions from our 33-slate sample without seeing a player-level distribution under the hood. Of the slates we tracked, running backs were the only position to outperform their ETR projection on average, scoring 0.2 DraftKings points more than projected, with a 45% beat rate, compared to wide receivers, who underperformed by 1.5 DraftKings points, and tight ends, who scored 3.1 points fewer on average, beating their projection just 30% of the time. The implication is that RBs are more likely to beat their mean projection.
CPT RB lineups don’t just produce a better average sim ROI; they also produce a better distribution of lineups. CPT RB lineups hit the Very Good threshold (>= 40% sim ROI) at the highest rate of any position (16.9%) and had the lowest Horrid rate (< -30%) at 12.9%. CPT TE, for example, hit Very Good just 6.1% of the time and found the Horrid bucket at a 27.8% clip.
The most important finding might be the construction trigger and compounding effect that CPT RB funnels lineups toward. CPT RB includes D/ST in FLEX at the highest rate of any position (17.8%). Of course, pairing CPT RB with same-team D/ST naturally correlates around a specific game-script bet. If our RB beats his mean projection, there’s an increased chance the game is playing out as expected and his team’s D/ST is also scoring well. CPT RB also correlates with higher utilization of five-favorite, one-underdog constructions (19.0%) and fewer three-favorite, three-underdog (29.0%) builds, compared to other positions. CPT RB creates a natural pull toward unbalanced builds, which result in a higher average sim ROI. When you combine these three elements: CPT RB + same-team D/ST + 5-1 roster construction, average sim ROI jumps to 24.6% with a 27.5% Very Good rate and just a 3.5% Horrid rate.
We know by now that max-entry players outperform single-entry players in every single metric. That holds true when we look at how they deploy the CPT position on an ownership basis. That means the ownership bucket(s) max-entry players most often utilize aren’t the primary driver of better lineups; rather, the decision-making process is better throughout the entire lineup.
We did, however, find that single-entry players are over-indexing heavily in the sub-5% CPT ownership range (25.4% utilization vs. 16.3% for max-entry players), chasing low-owned captains with an even worse likelihood of achieving a slate-winning score. Max-entry players allocated their CPT exposure more evenly across the 5-25% implied ownership range, where the sim most consistently assigns a positive ROI across all cohorts. While max-entry players still found a positive average sim ROI (+5%) when using sub-5%-owned CPTs, it was the lowest average ROI among all implied ownership buckets. Similarly, while single-entry players posted a negative average sim ROI across all implied CPT ownership buckets, their best results (-3%) came from the 25+% range. This isn’t to suggest we shouldn’t roster a low-owned CPT; max-entry players allocate 16% of their portfolios to the sub-5% range too. We just shouldn’t solely use low ownership as a reason to play them.
Roster Construction
We create the highest-quality NFL content
Our team includes renowned fantasy analysts Evan Silva and Adam Levitan, high-stakes professional DFS players, and specialists who cover niche areas that we believe are important to understand.
We don’t sell lineups or claim to have all of the answers. We do analyze what’s happening in a way that’s digestible and actionable, to prepare you to make the best decisions possible during the 2026 NFL season.
To read this content, you’ll need our NFL In-Season package.
Full Details! » Already a subscriber? Log In