Consistently one of the most volatile sports in the entire DFS ecosystem, PGA DFS is a unique beast that shares few similarities with its NFL, MLB, and NBA peers. Unlike team sports such as football and baseball, which require a Ph.D. in correlation to find DFS success, golf’s individual nature makes it near impossible to gain an edge on our opponents through correlated roster construction. Unlike NBA, where we can gain a significant advantage through projections by better understanding player rotations, minutes, and usage, accurately predicting golfer performance is inherently more variable. Fortunately, as game theorists, we can use this uncertainty to leverage our data and create +EV lineups.
Base Projections
“All models are wrong, but some are useful.” — George E.P. Box — Tom Peabody. As Tom astutely pointed out after yet another Patrick Rodgers-led discussion, our base projections driven by Rufus’ hole-by-hole simulations are not without their flaws, but they are consistently among the best predictors of golfers’ fantasy-point outcomes.
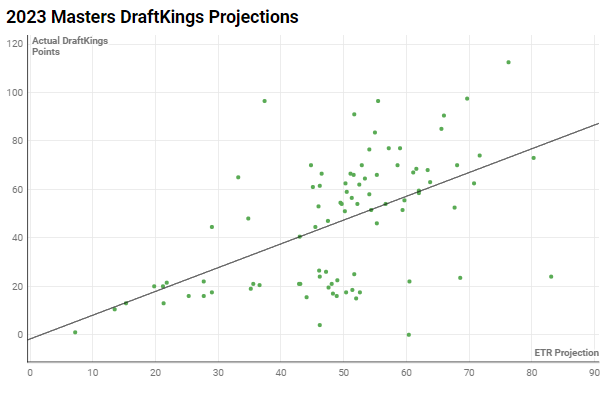
Using a one tournament sample from this year’s Masters, we can start to get an understanding of this concept and how we can use uncertainty to our advantage during lineup construction. For this 89-golfer field, our r-squared between base projection and actual fantasy points was a modest .30, better than simple data like DraftKings salary, ownership projections, or other publicly available projections, though still far from perfect. Our RMSE — the average error of our projections vs. actual — was 22.1 DraftKings points, meaning a golfer expected to score 50 DraftKings points could finish anywhere from 27.9 to 72.1 DraftKings points, on average. Instances where our projection correlation is closer to one and our RMSE is closer to zero will result in widespread success for those using them. While base projections are more guardrails than they are gospel, they should serve as a foundation for profitable lineup construction, particularly amongst users who aren’t confident in their ability to predict fantasy production.
Ceiling Projections, Volatility, and Chasing Tail Outcomes
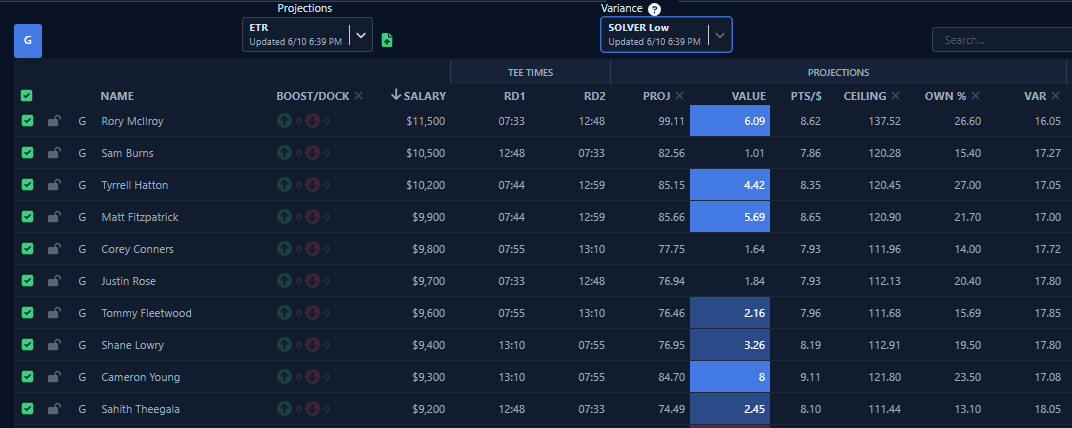
For those chasing the top-heavy payouts of large-field GPPs, it’s important to understand how to apply our volatility score and ceiling projections when building lineups. Our volatility score uses each golfer’s standard deviation to their mean projection in order to show the extent of variability on an easy-to-interpret 1-10 scale. When used in conjunction with our 90th-percentile ceiling projections, we can start to compare similar golfers who may have very different ranges of outcomes.
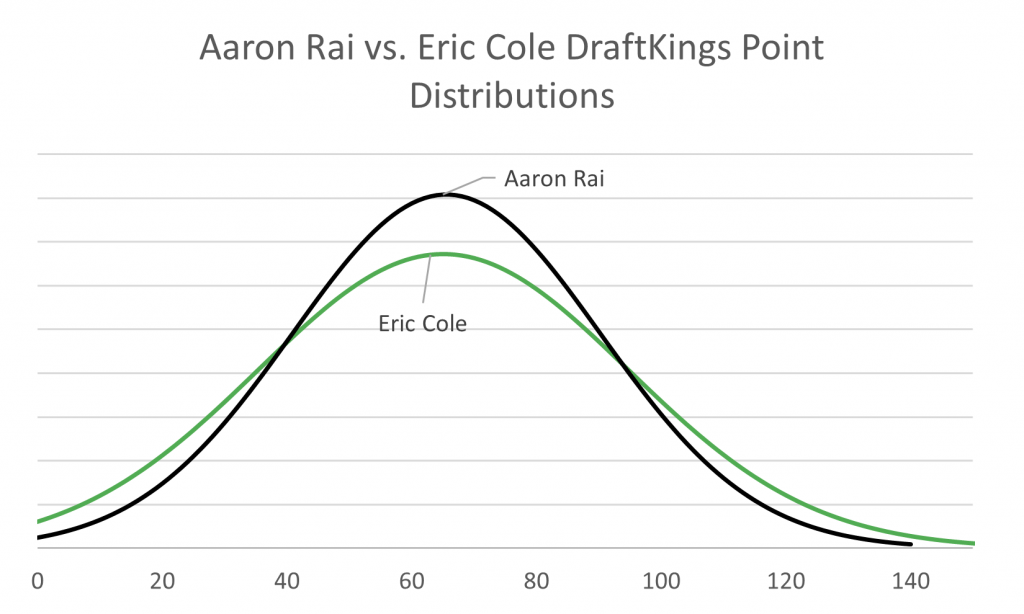
Aaron Rai (65.6) and Eric Cole (65.7) shared nearly identical DraftKings base projections at last week’s RBC Canadian Open. However, Cole’s ceiling (100.3) cleared Rai’s (97.9) by 2.4 DraftKings points, as his 5.4 volatility score represented a higher standard deviation than Rai’s 5.0. Along with lower odds to make the cut, the increased variance in Cole’s game presents a wider range of outcomes that can improve our chances of finding a slate-winning performance when compared to Rai, whose simulated scores were much more clustered around his average.
Ownership Projections
While we can still capture small edges by beating the market’s fantasy-point projections, PGA DFS was a game built to be played by game theorists who are most interested in leveraging accurate ownership projections to take advantage when their opponents are too certain about very uncertain outcomes.
Though it’s admittedly difficult to predict golfer outcomes, identifying what our opponents are going to do in large-field GPPs is something we’ve been able to do with unmatched precision. Dating back to 2022, our ownership projections have posted a .923 r-squared when compared to actual ownership from the flagship GPP on DraftKings. More importantly, our RMSE, a metric that measures the average difference between our projections and actual ownership, is 1.7%. This indicates that ownership results are tightly clustered around our ownership projections.
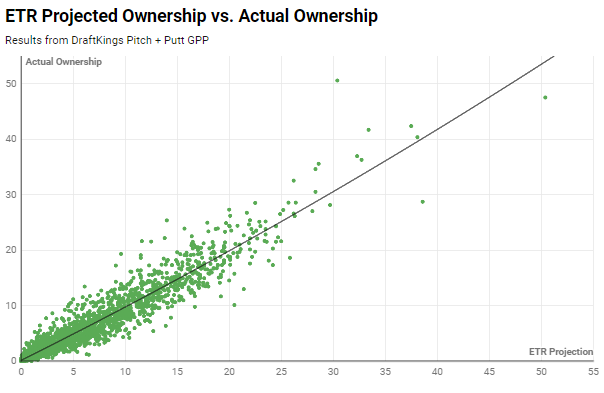
While they can be universally applied to any of the large-field contests on DraftKings, including the Pitch + Putt, $5 buy-in Drive The Green, $0.50 mini-MAX, $3 20-max Birdie, and more, it’s important to consider how ownership results may vary as stakes increase and field sizes decrease. Using the $200 buy-in, 1,111-entry Driver as a proxy for small-field contests, we notice that our ownership correlation falls to .856 and our RMSE climbs to 2.5%, opening up a wider range of ownership outcomes in these types of contests.
Even if we aren’t making adjustments to ownership projections based on the contests we’re building lineups for, it makes sense to think about ownership, like we do fantasy points, on a spectrum. Generally, when golfers are appearing in optimal lineups at a rate higher than they’re projected to be owned, they’re more likely to suffer from small-field steam.
Even after weekly manual adjustments, it’s also important to understand our ownership algorithm’s blind spots for golfers who may be higher- or lower-owned than we project based largely on tough-to-quantify public perception. Improving these individual ownership projections can help identify golfers that may consistently project well but often go overlooked or flush out poorly projected golfers that will be over-owned.
The field’s proclivity to rostering young golfers has resulted in our ownership projections consistently missing low on newcomers like Akshay Bhatia (4.8% average ownership projection vs. 7.9% actual), Sahith Theegala (8.8% vs. 11.8%), and Nicolai Hojgaard (8.4% vs. 12.6%) to name a few. Knowing the ownership range of outcomes is shaded toward the higher end for golfers that fit this profile will help when it comes time to IKB (I Know Better) the projections — more on that in a second.
Putting it All Together with Roster Construction
I steer clear of rigid rules, groups, and optimizer settings, in part because of the inherent randomness of PGA DFS, but also because the lever pulling necessary to create profitable lineups can and will change each week based on slate-specific dynamics. With that in mind, these are some guardrails to consider when building large- and small-field GPP golf lineups.
DFS OPTIMIZER: If you are looking for a DFS optimizer, we have two options for ETR subscribers. Both of these products will sync automatically with ETR content (projections, ownership, etc.) if you already have an ETR golf subscription. Use the following links for full details about each product: THESOLVER (Optimizer + Bankroll Tracker) & Fantasy Labs (Optimizer).
1) Use golfer-specific variance, or increase variance on a smaller subset of golfers
As noted above, our volatility score shows the extent of variability in relation to each golfer’s base projection. Golfers with a higher volatility score have a wider range of outcomes. In The SOLVER, we can account for differing degrees of variance in a few ways. One such solution is to manually increase the variance for the low-priced golfers that generally come with a higher volatility score. Doing so will result in more evenly distributed exposures and help limit the amount of correlated risk across our lineup portfolio.
2) Use at least (3) golfers under 15.0% projected ownership
Particularly with weekly ownership constraints, I think it’s important to be fluid and willing to adjust parameters to account for slate-specific dynamics. With that in mind and an understanding that the ownership rules to consider that follow are NOT taken from a historical study of winning lineups, I think combinations of these can improve your overall expected value. Of the large-field GPP lineups in the sample I studied, 96.7% used at least three golfers who had a final ETR ownership projection of less than 15.0%.
3) Use at least (2) golfers under 10.0% projected ownership
In the same vein, 94.7% of lineups in the same sample used at least two golfers with a final ETR ownership projection below 10.0%.
4) Use at least (1) golfer under 5.0% projected ownership
In order to really facilitate unique roster construction across a portfolio of lineups, it helps to embrace the randomness of PGA DFS by dipping our toes into uncomfortable waters. 89.2% of aforementioned lineups used at least one golfer with an ownership projection below 5.0%.
5) Lineups should use less than 85.0% cumulative ownership
Using some combination of the rules above is likely to make this rule a moot point, but a roster’s cumulative and product ownership is more indicative of expected value than the ownership of any single roster spot. Setting a max ownership cap of 85.0%, something 88.3% of lineups did, will help avoid overly popular constructions that have fewer paths to climbing leaderboards.
6) Lineups should use less than 2.5% product ownership
The best use of ownership projections, product ownership combines many of the concepts discussed above. Rather than adding the six individual ownership projections of a given lineup, product ownership multiplies a roster’s individual parts to get a sense of its overall popularity. Take this lineup from the 2023 Mexico Open as an example: (50.4%, 29.7%, 12.2%, 7.0%, 1.3%, 9.5%). Despite 110.1% cumulative ownership that wouldn’t have passed through our cumulative ownership filter, this is an acceptable large-field GPP lineup based on its combinatorial uniqueness that resulted in 1.6% product ownership. In The SOLVER, this number is displayed as the product sum of the lineup multiplied by 10,000.
7) You can and should IKB the fantasy-point projections
For all of the ownership constraints listed above, maybe the best way to build unique lineups is to use a set of projections that are influenced by your own inputs. I think most IKBs (I Know Betters) should follow a generic decision-tree framework with an initial question that asks, “Is this projection wrong because of a tough-to-quantify variable?” Some of the factors that may be difficult for simulations to quantify could include: golfers playing through injury, golfers returning from injury, golfers that are new to the Tour and have limited samples, golfers that have recently made equipment, swing, or coaching changes, etc. In all of these cases, it’s important to consider if there is asymmetric upside, i.e., is the upside potential greater than the downside risk? In almost every instance, the answer to that question will be determined by the golfer’s projected range of ownership outcomes. Accepting more downside risk at elevated ownership is a long-term losing strategy. Though there is no perfect way to quantify all of these factors, The SOLVER makes editing projections and tweaking exposures very simple.