While consuming dynasty rookie draft content, I workshopped an idea that Marvin Harrison Jr. may be a better rookie draft selection than Caleb Williams. In my head, MHJ and, to an extent, Malik Nabers are in a special tier of WR prospects bordering on can’t miss. No prospect is a “can’t miss”. Projecting what college players will do in the NFL is one of the most difficult tasks, but MHJ and Nabers join Amari Cooper and Ja’Marr Chase as the best WR prospects over the last decade or so.
On the flip side, I’m worried about the odds of success of any QB at the NFL level. Anecdotally, we’ve seen some high-end QB selections completely flame out at the NFL level — Sam Darnold, Zach Wilson, and Trey Lance were all top-three real-life selections. Now, in dynasty fantasy football as in real life, the best (and almost only) way to get an elite asset at the QB position is to draft these types of QBs, even if the hit rates are a coin flip.
My galaxy brain idea is that a startup or rebuilding team is possibly better off taking an elite store of value in MHJ that has a hit rate of 80% (arbitrary guess) over a QB that has a hit rate of 50%, even if the QB carries a little bit more high-end upside.
Now, this article does not do a deep dive into Caleb Williams versus MHJ. The TLDR is that I believe my half-baked idea is wrong, and it’s something I will look into deeper with our dynasty expert Anthony Amico on the next episode of Establish the Edge.
However, that idea was the impetus for this article. Are QBs as risky as I fear, even knowing their upside in Superflex formats? In general, how have the various first-round rookie draft picks fared over the last several years? Is there anything we can learn from those results?
This article is mostly meant to be a fun, descriptive look at past results to help us check our biases at the door and have a more objective view of how the results for certain positions, ADPs, and years have turned out. It’s not meant to be predictive, especially given issues with sample sizes and how different the rookie draft landscapes are from year to year.
2020-2023 Rookie Draft Results
I looked at the first-round choices of every rookie draft from 2020-2023, assigned them a draft capital number, and assessed if the pick was successful or not based on their current market value in the Establish The Run Dynasty Trade Calculator.
I chose 2020 as a starting point because:
- Intuitively it felt close enough to the present to be relevant while going far enough back to give us a bigger sample size.
- 2020 was the first year I had multiple rookie drafts across several sharper dynasty leagues (started playing in 2018ish).
The ADP I assigned to each pick was based on the handful of sharper dynasty leagues I am in, so it might not line up exactly with the global ADP those players had. I broke ADP into four buckets, and here are those four buckets along with the associated draft capital assigned to them:
- First Overall Pick 400 (near consensus 1.01 selections)
- Early First 346
- Mid First 250
- Late First 212
I used some subjectivity here, so in some draft classes I may have included 14 players instead of 12 or have more or less “Early First” ADPs based on how variable the market was in that given year. The draft capital assignment comes from our 2025 market values for Early, Mid, and Late first-round picks. I gave the “First Overall Pick” bucket a subjective bump. These values are likely globally “light” since they are a year out, something you’ll see tangibly in the analysis, but serve as a good relative barometer of value.
To measure a player’s current value, I used their specific market value (100% market, 0% ETR) from our trade calculator. The reason I stripped out the ETR influence is because I did not want the results to be a self-fulfilling prophecy. For example, we’re generally below market on RBs and above market on WRs. If we used the current ETR trade values, we might come to the biased conclusion that “all the WRs were good picks and the RBs bad picks”. It’s certainly important to keep in the back of your head as you consume this data that the market has its own biases, but I felt this was the most objective way to track a player’s current value.
For example, here’s how Ja’Marr Chase’s current market value compares to an early 2025 first’s value:
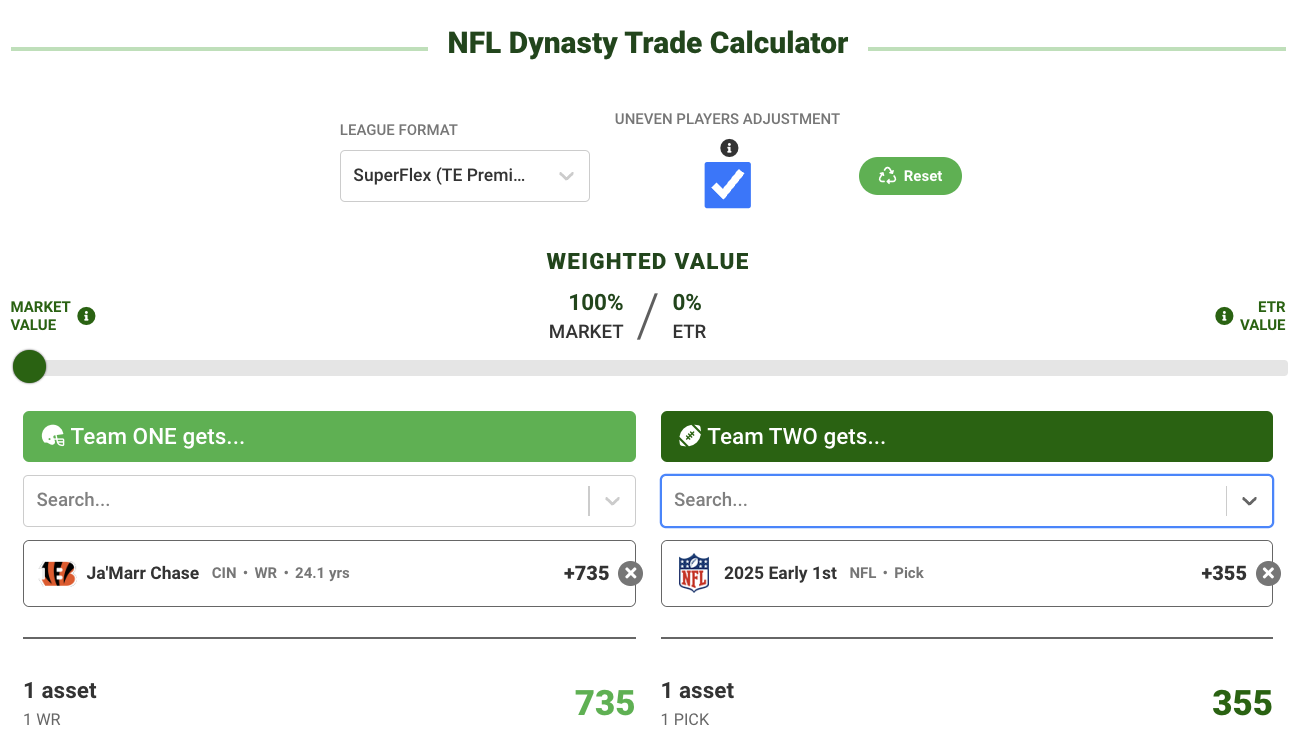
Based on their current trade value, I labeled players as a Boom pick if their current value is greater than a 2025 Early First and a Bust if their current value is less than a 2025 Second. There’s a ton of nuance in between being a Boom or a Bust, and I calculated the profit of each pick as well (Current Value – Draft Capital).
One final note, I lumped TEs in with WRs and am calling this a pass catcher group, which I think is fair given that I am assuming a Superflex/TE-Premium format, and there would be such a small sample on TEs if isolated.
Here are the full results.
That’s a large graphic and difficult to parse through. I wanted everyone to see the detail I am using, but let’s chop it up into some different segments and see if we can pull away any meaningful insights.
By Position
The idea that drove me to do this analysis was a positional argument. Here are the results grouped by position:
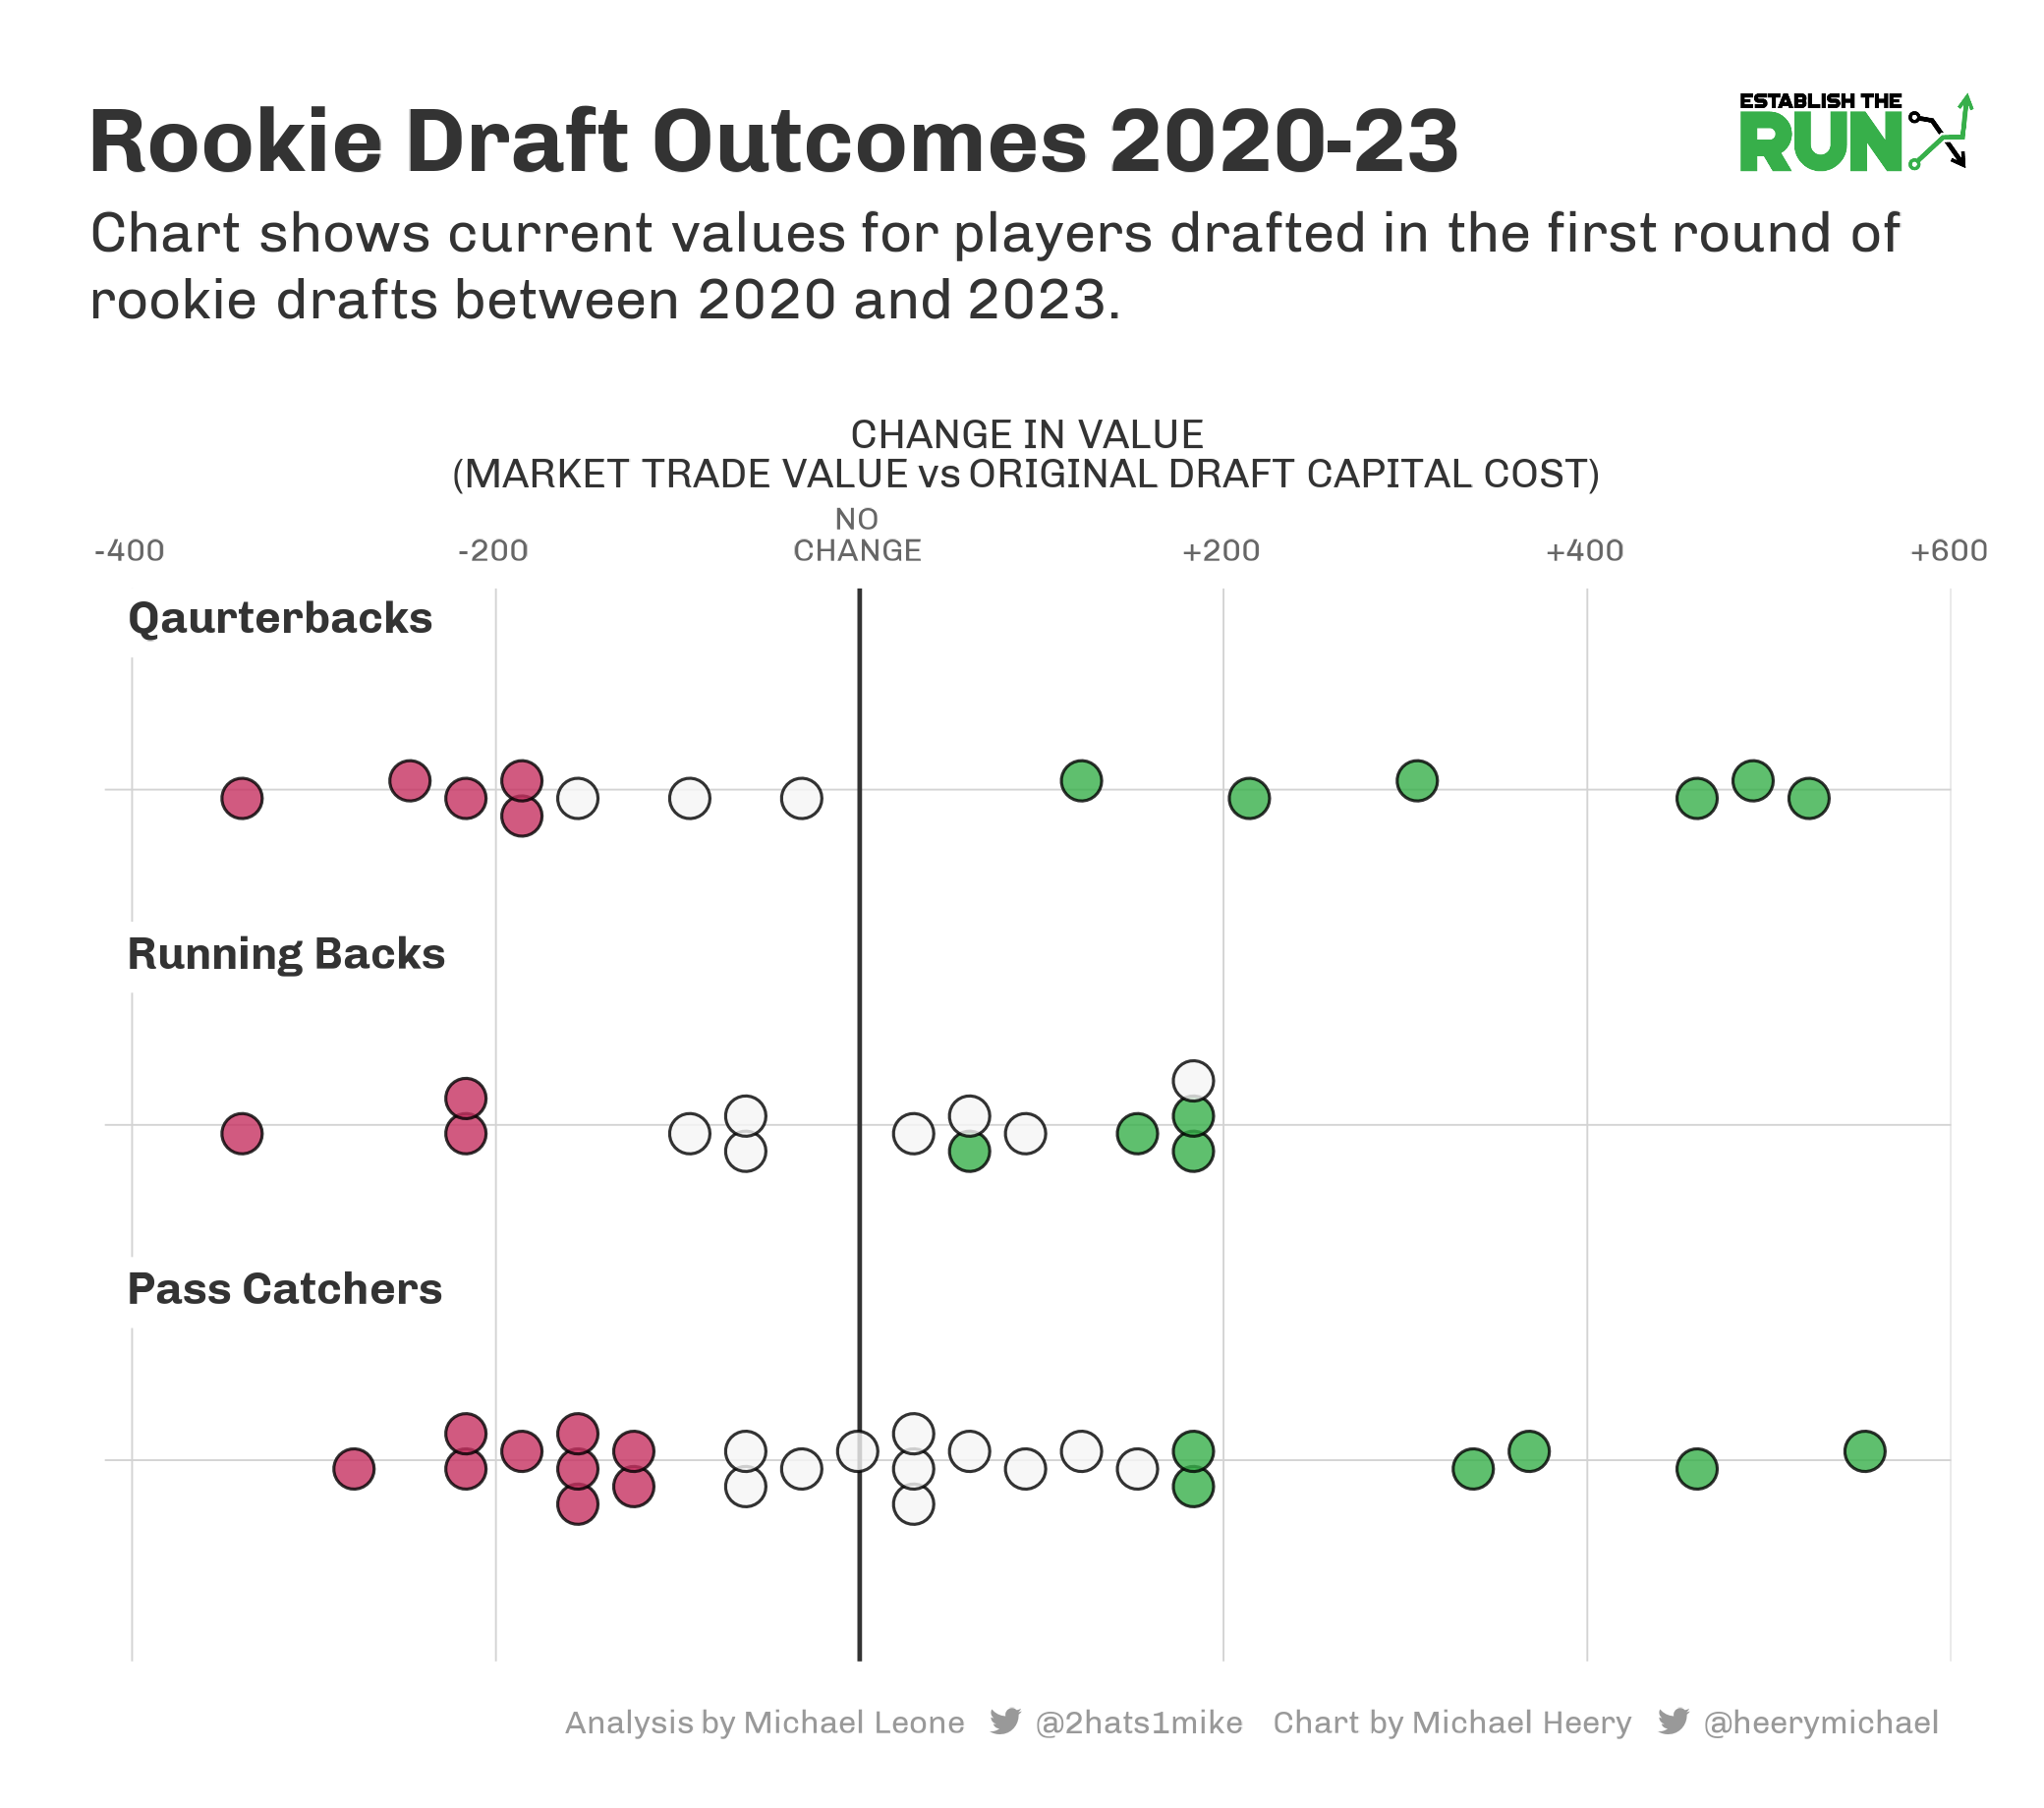
QBs Most Profitable
The QBs stick out to me as much more favorable selections than I had expected. While they do slightly outpace the WR position in Bust rate, they have far and away the best average profit and Boom rate.
Here’s the detailed list of all Early First QBs:
![]()
Viewing those results, you start to understand why Anthony Amico and our ETR team have Caleb Williams with such a high trade value and ranking right now.
The hits at the QB position provide such massive returns. Joe Burrow, four years later, is trading at a huge profit. Anthony Richardson has played 3.5 games, and based on the potential of that alone, his Superflex trade value is enormous.
On the flip side, Trey Lance is the only Early First QB here who has completely bottomed out. Meanwhile, Justin Fields, somehow, has retained a decent amount of trade value, despite being iffy to ever start again in the NFL. The same can be said for Bryce Young, who is coming off about as bad of a rookie season as possible. I recently traded Young and the 2.03 for Tyreek Hill in a league. I’ve also been offered multiple-round picks for Justin Fields. The trade value is headed in the wrong direction, but there are opportunities to escape without taking a full loss (like there was for Lance up until this past season).
Subjectively, I’d label Fields and Young as Busts, which does show the volatility I feel with an early QB selection (it’s either going great or it’s going terribly), but objectively the trade values don’t suggest Fields and Young are full on Busts yet (Young is still the clear starter for a new coach and could see his value even bounce back pretty quickly with a good start).
RB Timelines are Short
Looking at all the RBs taken since 2020, the results reaffirm what we already know: Good RB selections are immediately very valuable, but the shelf life is short:
![]()
Two RBs drafted in 2020 have gone completely to zero, and J.K. Dobbins is close to making it three of five. Meanwhile, Jonathan Taylor and D’Andre Swift were once immediately huge hits (like we see with the 2023 class), but they are now breakeven picks when viewed together. Don’t take this the wrong way; breaking even while banking four years of production on a player is a great result, but as you’ll see with WRs, they can sustain those peak values for longer.
Before we move to WRs, though, it’s worth pointing out that the bust rate on RBs is much lower than I expected. However, despite busting at a meaningfully lower rate than WRs, WRs provide a higher average profit.*
*If you’re using ETR trade values, the profit gap between WRs and RBs is much wider. A reminder that these visuals are based on the market trade values solely.
The Pass Catchers
With WRs, we immediately see how long hits at the position can sustain high-end value, as CeeDee Lamb, Justin Jefferson, and Ja’Marr Chase are all top-15 assets in our dynasty rankings 3-4 years later.
![]()
In a way, WRs are much more similar to QBs than RBs. Their value is driven so much by their skill that we see similar volatility in the results, but we see less opportunity to sell off after a disappointing start to a career (Quentin Johnston, Skyy Moore, Treylon Burks, etc.).
We’ll touch on how different some of these draft classes were shortly, but while we are at WR, I want to point out that Ja’Marr Chase is likely the only fair comp to MHJ and possibly Nabers. The above is fun to look at and useful when considering the context, but please make sure you consider that context. Not all draft classes are the same.
The Chase/Pitts versus Fields/Lance/Lawrence dynamic from 2021 is likely the most representative of the MJH/Nabers versus Caleb Williams dynamic we’re currently facing.
By Year
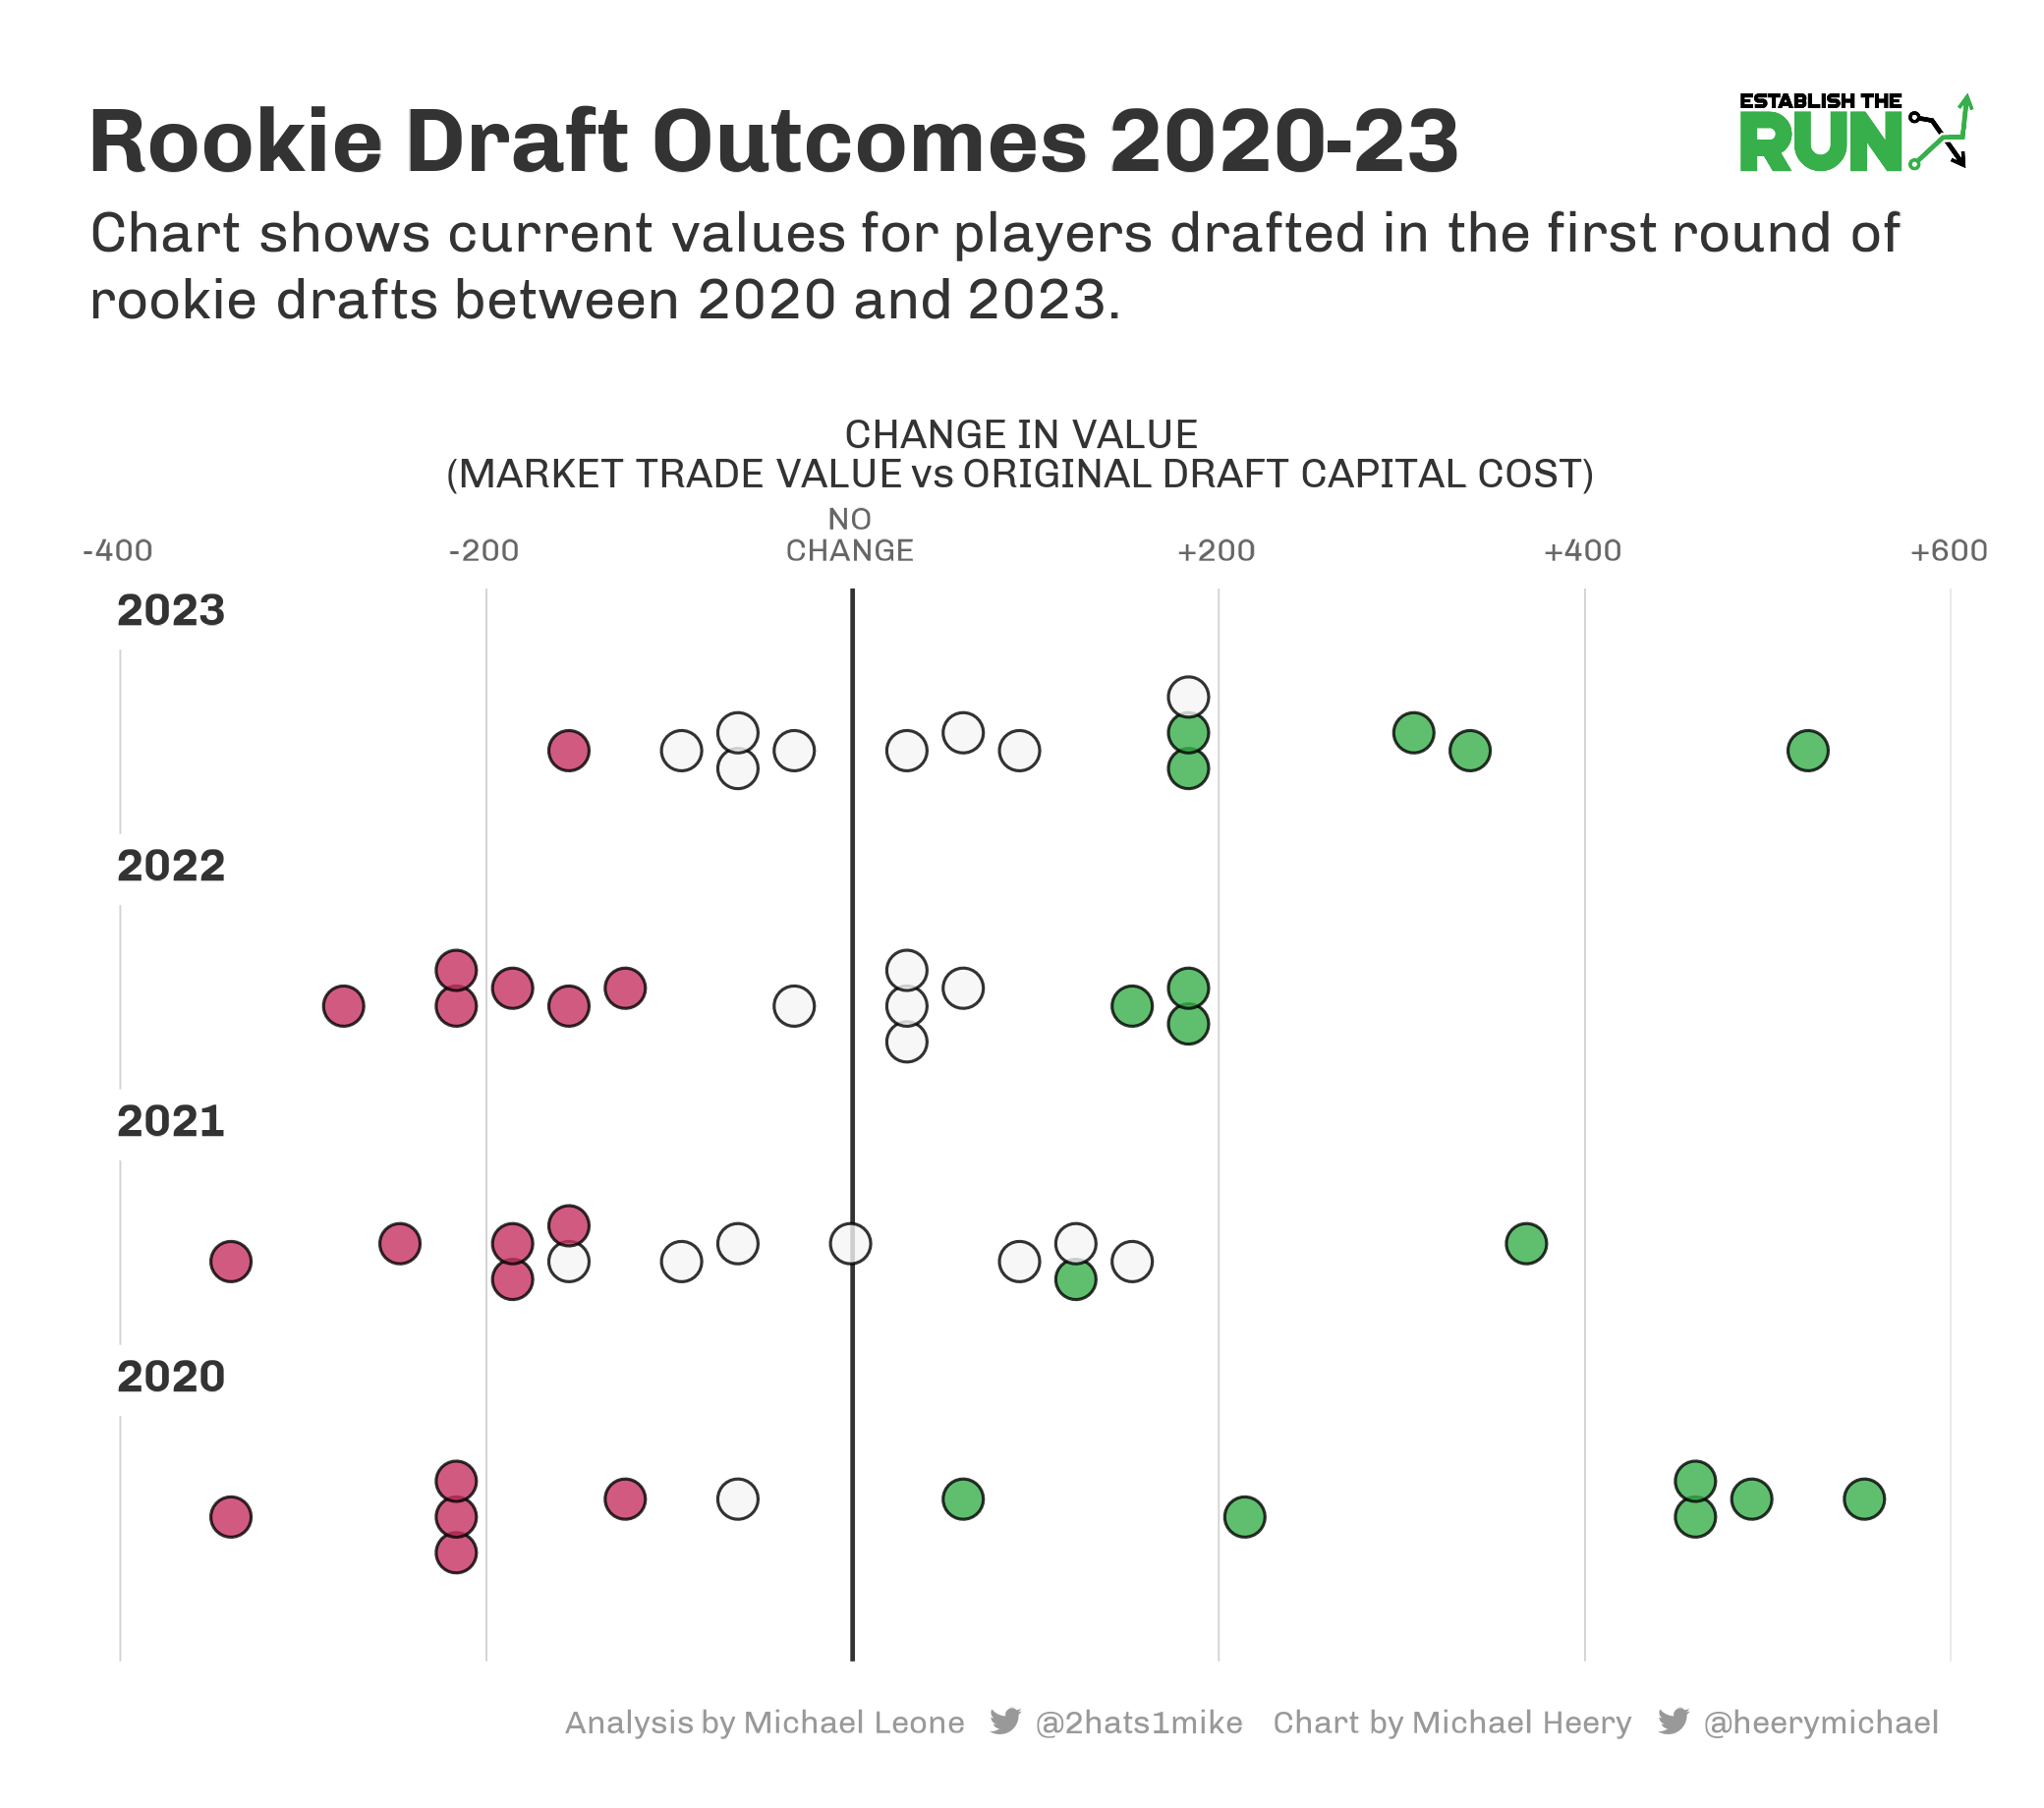
Anecdotally, I’d say we as a whole do a pretty good job of understanding if we’re looking at a good or bad rookie class on the whole by the time the offseason rolls around before the NFL Draft for that given year. Still, it’s not perfect. We did know 2022 was a particularly weak rookie draft, but Fields, Lance, and RB declines make 2021 look much weaker than expected.
By ADP

It’s clear from the data that Early Firsts provide an outsized value proposition relative to the rest of the round. Of the 18 players taken either first overall or elsewhere Early First the past four seasons, 56% are Boom picks and just 16.7% are Bust picks. Meanwhile, mid to late firsts are a pretty similar value proposition to one another. Both net out to a roughly breakeven profit, a 40% Bust rate, and a 17% Boom rate. In previous dynasty analyses I’ve performed, I’ve found that late firsts can often be overvalued while early seconds are undervalued. While I didn’t include second-round picks in this analysis, the steep drop-off throughout the first round likely supports that notion.
It’s important to consider that an Early First in one year could have a vastly different expectation than an Early First in another year (and the same for middle to late firsts), so you need to closely analyze your current draft landscape before assuming these broad value propositions hold. For this particular draft landscape, I think that they do, though I’d extend “Early First” as a value proposition out to 1.07/1.08 territory.
A final note from the results that I found interesting: We know using 2025 draft picks as our basis for ascribing draft capital shorts us a little (because of a present value calculation), but the average trade value of all picks in my analysis since 2020 is currently at 298. The average starting draft capital of all those picks is 271. Making that PV adjustment, it’s pretty close to a net even there. I don’t have any conclusion to that, but I found it interesting.
Tidying Up
Each draft class and prospect is unique. These sample sizes are small; one past prospect vastly under or overperforming their Draft Capital could wholesale change the macro analysis by position, year, or ADP.
Still, it’s always good to have some tether to actual results to keep our vibes in check. For me, I’m not drastically changing how I draft based on the descriptive analysis above. But it does make me feel a little bit better about:
- Taking Caleb Williams 1.01 (QB trade value holding up so well)
- Taking RBs in good landing spots on win-now teams
- Chasing pass catcher upside over RB upside when thinking long term
- Putting a real premium on the high-end rookie picks
- Trading down for multiple picks once I hit the back end of the first round