
It is difficult to discern the value of rookie picks in Dynasty leagues, but doing so is important when trading away or for rookie picks. It’s also important to weigh positional needs against best player available, though the latter is often the best strategy.
I’ve looked at Non-SuperFlex Rookie ADP data from 2010-2019 and analyzed the success rates of every pick based on rookie and sophomore year performances to help gauge the reasonable range of outcomes based on position and pick number. Of course, players can become valuable after their first two years, but there’s generally a two-year window for players to establish trade value, something our own Pat Kerrane emphasizes when establishing his dynasty rankings. (You can also find Kerrane’s Rookie Draft rankings here.)
It’s important to remember that each rookie draft is very different. For example, the fifth pick in SuperFlex rookie drafts this year is very different than in previous seasons because of the unique level of high-end depth at the QB position, which will push skill players down. Still, the goal of this article isn’t to be overly precise; the goal is to provide a rough framework for you to work off of while providing some interesting nuggets.
Thank you to @RyanMc23 of Dynasty League Football for providing me with the ADP used to do this analysis.
I wanted to keep this analysis as simple as possible, so I charted outcomes by these simple definitions:
— Viable outcome: 264 FPs for QBs, 171 for RBs (PPR scoring), 177 for WRs, and 147 for TEs. This is roughly what each position needed to score to be a year-end starter at each position (Top-12 QB, Top-24 RB, Top-36 WR, Top-12 TE).
— Elite outcome: 299 FPs for QBs, 220 for RBs, 223 for WRs, 183 for TEs. This is roughly what each position needed to score to be a top-half starter at each position (Top-6 QB, Top-12 RB, Top-18 WR, Top-6 TE).
UPDATED: This article was updated on April 24th with corrected data.
Total Number of Viable or Elite Seasons
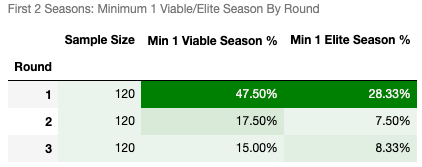
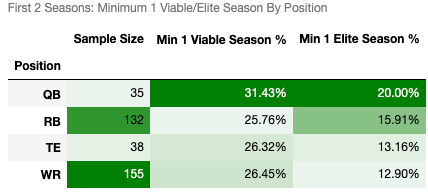
Minimum 1 Viable or Elite Season
Conclusions
Before we dive into the specific conclusions from the above data, it’s important to keep some context in mind.
Caveats
- While these percentages may look low overall, it’s important to interpret them in the context of your league. Playing in a SuperFlex league? Immediately these percentages will look better because of the deeper QB pool lowering the viable/elite scores for that position and pushing skill players further back in the draft due to QB demand. If you’re in a shallow league, these percentages carry a bit more direct application. If you’re in a deeper league, there are players who will still be useful from rookie drafts despite just missing our viable/elite thresholds.
- Each year is different. The idea of this article is to get a good grasp of general expectations based on roster and draft position, but one year’s eighth pick may be thought of more highly than the previous year’s fourth pick. The data above does not try to account for that.
- Success rates aren’t necessarily directly aligned with payoffs. For example, getting a viable QB season in a Non-SuperFlex league is likely less important than getting a viable RB season. The data above does not attempt to differentiate between the two, and this is another example of why it’s important to view this data in the context of the league you’re playing in.
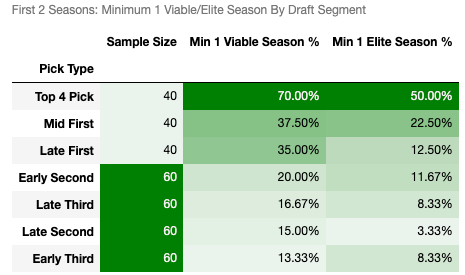
Draft Position
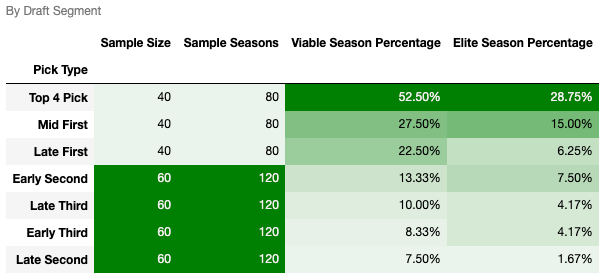
Looking at the data by draft segment, it’s clear that rookie drafts are pretty efficient. We see logical drop offs in success rates as we move throughout the three segments of the first round and into the second round. Here are the most interesting notes to me:
- We see why there is such a premium for picking early in rookie drafts. Top-4 picks have posted more elite seasons than the rest of the first round combined, and there’s ~ 25% chance that a Top-4 pick will post at least one elite season during his first two years.
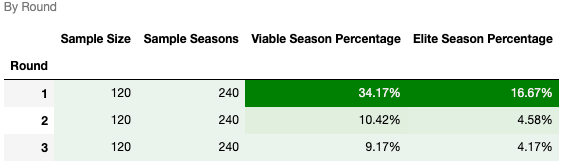
- It’s possible that early second-round picks are undervalued. They seem to carry a little more risk than late firsts but roughly the same amount of upside. However, there’s a pretty big value perception gap between a 1.10 and a 2.03 (you can see why this may be if you look at the success rates by round rather than draft segment). This is something you can subtly take advantage of in trade markets.
- Meanwhile, late seconds generally are much worse bets than early seconds and not that much different than third-round bets.
- Draft position in the third round is mostly irrelevant.
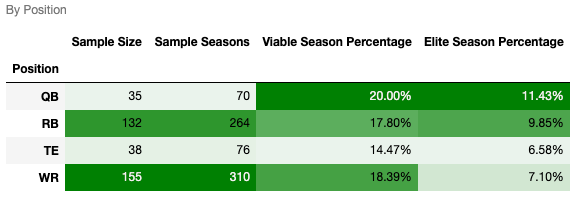
Roster Position
- QBs aren’t often drafted in Non-SuperFlex rookie drafts, but they have strong success rates when they are. They have the highest viable and elite season percentages of all positions, and their lead escalates when you look at minimum one viable/elite season (likely due to QBs who don’t start immediately Year 1 but are successful Year 2).
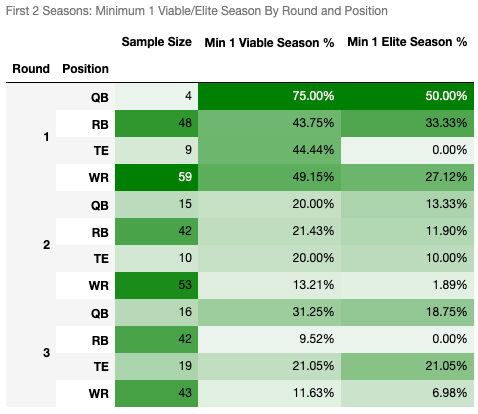
- While this is Non-SuperFlex data, it can be useful for SuperFlex leagues. In particular, if a QB is good enough to crack Round 1 Non-SuperFlex rookie drafts, they have awesome hit rates. It’s a small sample (only four QBs managed this level of ADP), but three posted a viable season in their first two years and two posted an elite season in their first two years.
- We’re more likely to get an elite season from a rookie RB than a rookie WR, but the hit rate on viable seasons is comparable.
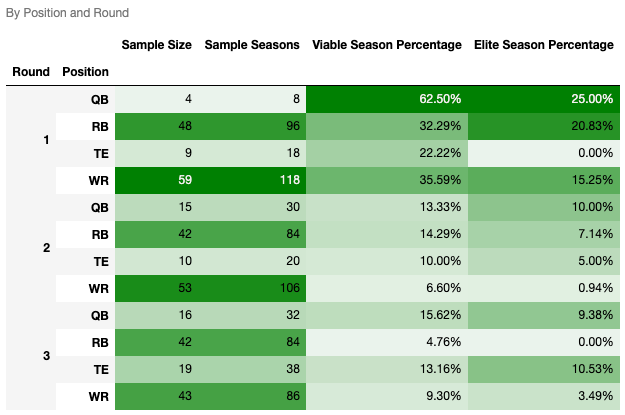
- It was surprising to me, however, that Round 2 RBs seemed to outperform Round 2 WRs so handily. I would have expected the RB advantage to be in Round 1 given available information surrounding expected opportunity/volume for RBs based on NFL draft landing spots. Oddly, though, Round 1 specific analysis concluded “more elite upside for RBs, more viable safety for WRs”, which is somewhat similar to the overall positional trend. However, Round 2 RBs really trounced Round 2 WRs in success rates. I think this is less about Round 2 WRs being overvalued than it is perhaps the market undervaluing that second tier of rookie RBs who slip to Round 2 in part because they lack the certainty of the Round 1 RBs.
- Meanwhile, WRs turned the tables on RBs in Round 3. The deeper rookie drafts get, the tougher the climb for RBs to earn opportunity. Again, these are macro trends to consider, not gospels to live by. Antonio Gibson, who is not included in this data set, was an absolute smash pick falling into the third round of some rookie drafts last season. In general, though, WR is the smarter bet as you get deeper into drafts.
- UPDATED (4/24): As bad as the overall positional numbers look for TEs, keep in mind that their success rates are watered down because we rarely get a Round 1 TE. Of 38 TEs in this sample, 23.7% were drafted in Round 1 (and generally lower in Round 1 when they did get selected there). Meanwhile, over 35% of both RBs and WRs were drafted in Round 1. What we see at TE is that the rare Round 1 TE is much safer than Round 2 and 3 TEs, but we’ve been bad at predicting elite TE upside. Remarkably, none of the 9 Round 1 TEs turned in even a single elite season, while Round 3 TEs had the best hit rates on elite seasons thanks to Aaron Hernandez, Jimmy Graham, Rob Gronkowski, and Mark Andrews (note Travis Kelce was a late 2nd). This doesn’t mean that we would expect Round 3 TEs to continue to outperform Round 1 TEs in terms of elite seasons and that you should ignore Kyle Pitts this season. That would defy logic. It does mean that we’re likely bad at predicting where elite TE seasons will come from in general.
UPDATED (4/24): Just for fun, from 2010-2019 there were only eight rookies (out of 360) that posted elite seasons in each of their first two seasons:
- Cam Newton — 2011 (Pick 17, QB1)
- Eddie Lacy — 2013 (Pick 4, RB2)
- Odell Beckham — 2014 (Pick 5, WR4)
- Michael Thomas — 2016 (Pick 7, WR5)
- Christian McCaffrey — 2017 (Pick 4, RB3)
- Alvin Kamara — 2017 (Pick 8, RB5)
- Kareem Hunt — 2017 (Pick 13, RB6)
- Saquon Barkley — 2018 (Pick 1, RB1)