
In daily fantasy there are a number of ways to get an edge. Two of the most powerful strategies – especially in tournaments – are to identify cheap players set to have a big week, and to own at least one player the public is fading to create differentiation in your line ups.
The Air Yards Buy-Low Model we will publish each week here on Establishtherun.com was built to help identify receivers who fit both criteria. How it goes about accomplishing these goals is important to leveraging the results it spits out, so what follows is a bit on the theory behind the model and why it’s useful.
Editor’s Note: Week 1 is approaching. Be sure to check out our In-Season Package, which includes Evan Silva’s Matchups Column, two late-week live shows with Silva and Adam Levitan, Josh Hermsmeyer’s Buy-Low Model, Pat Thorman’s rankings and tons more. Prices won’t last so head here.
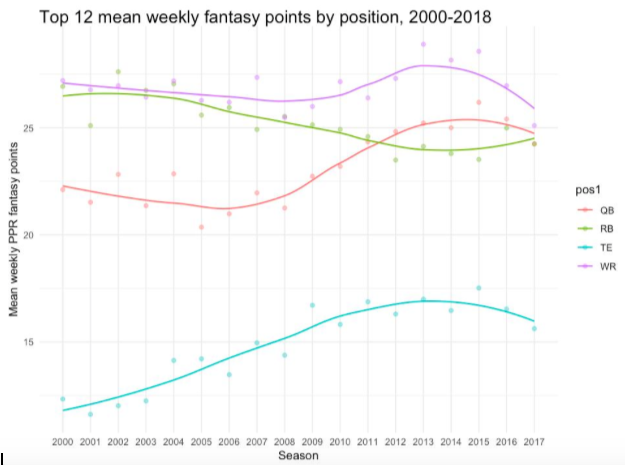
Wide receivers are crucial to cashing in tournaments (and particularly DraftKings tournaments) because the top performers at the position tend to score the most points in a given week. The chart below shows the average weekly DK score for the top 12 players at each position by season. Since 2004 the top scorer in a given week is very likely to have been a wide receiver. Moreover, at no point since 2000 have the top 12 in a given week averaged below 25 DK points, which can’t be said for any other position.
The problem with wide receivers is that it’s harder to predict who will be in the top-12 in a given week compared to running backs or quarterbacks. Running backs are volume dependent and that volume is often easy to see coming. Injuries and past behavior by certain coaches and playcallers make identifying likely bell-cows relatively straightforward. Under center, quarterback value is driven by efficiency and that can also be projected fairly reliably on a week-to-week basis based on a player’s historical production.
Receivers, on the other hand, are a special breed. They flood the field in a typical NFL game. Three wide receiver sets have been the base offense in the NFL for years, and the progression to spread concepts that attack the field horizontally with five legitimate receiving threats shows no signs of letting up.
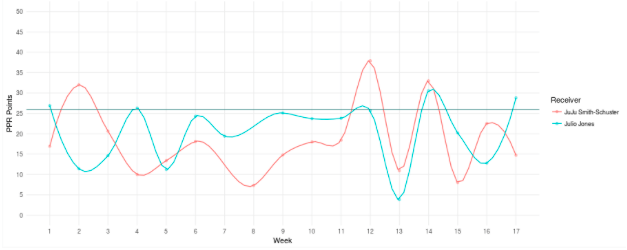
To unearth who has the best chance to be a top performer in a given week, you can’t just limit yourself to the studs. While great WRs give you a solid floor each week, they are often expensive and their down weeks are unpredictable. Below is a plot of Julio Jones and Juju Smith-Schuster’s DK points by week in 2018. You can see that each player exhibits a scoring pattern reminiscent of a sine wave, with high scoring games sometimes immediately followed by low scoring ones. Nowhere in DFS is recency bias more expensive to your bankroll than at the wide receiver position.
Crucially, the up and down pattern above exists for every WR in the NFL, regardless of their skill set. So the question becomes, can we time those breakout games somehow? Are there leading indicators that can help us forecast when a breakout week is coming and take advantage?
The answer is yes. Each week on Establish The Run I’ll post a list of receivers who have recently underperformed their opportunity as measured by things like targets and air yards. Typically 40-60% of the players identified on the list will outperform their implied value, and on many weeks you’ll see one in a Milly Maker lineup. In fact, in 2018 a buy-low model player made a Milly Maker lineup each of the five first weeks of the season.
The model works because volume is “sticky.” Teams and quarterbacks target receivers that they want to see get the ball. If a player gets eight targets with lots of air yards behind them, but he only catches one or two balls for 20 yards, many will begin to fade the player. If he has multiple games like this they may write him off entirely, making him low-owned.
But often what we thought was clear evidence that a player was bad turns out to simply be variance. Teams will come back to that receiver in the future and pepper him with opportunity when the opposing team – and the public – least expects it. And because touchdowns follow WRs who get opportunity, when a player finally starts catching those passes and he eventually gets on the right side of variance, he doesn’t simply turn in an average game. He crushes his projection and delivers a crooked number for his owners.
While the model is based entirely on the math and numbers, Evan and Adam will layer in their expert analysis on the players identified by the model each week for those that enjoy the human touch. I also believe in transparency. Each week of the regular season I’ll report the results of model backtesting for calibration purposes before the games. I’ll post the results of the model predict vs. actual in the following week’s column. We’ll also provide tips for using the model in your line up construction process, and I’ll call out QB/receiver stacks that I think make sense in a given week.
We’re less than two weeks away from kickoff. I can’t wait to get started. LFG.