
Using ETR Solver NFL Sims
Part 1: Do The Solver Sims Work? | Part 2: DFS Variance Affect on Bankroll | Part 3: How to Make Good Lineups Using DFS Sims
Part 1: Do The Solver Sims Actually Work?
For background, The Solver‘s sims attempt to predict how a given lineup will perform in a DFS contest. In order to do this, the tool predicts what the lineups entered into the contest will look like (the field lineups), simulates the results of NFL games, and then allows the user to see the simulated ROI, Cash Rate, and other metrics of lineups they are considering playing.
Our testing has shown that our tool’s ability to predict the construction of field lineups is strong, as is our simulated fantasy point distributions and correlations. But how is this actually performing in practice with real world lineups and contests?
That is where “Post-Lock Sims” come into play.
Last NFL season, we unveiled our Post-Lock NFL DFS contest sims over at The Solver. The Solver takes ETR’s same aforementioned NFL game simulations each week and combines them with the actual lineups played in a variety of DFS contests on DraftKings. Like with the pre-lock Solver sims, in addition to the actual standings of the contest, the post-lock sims show how often we expect each actual lineup to win, cash, place in the top 10, etc. The number that draws the most attention is the Sim ROI, a single number that depicts a lineup’s average return on investment over all of our sim iterations based on total prizes won and total entry fees.
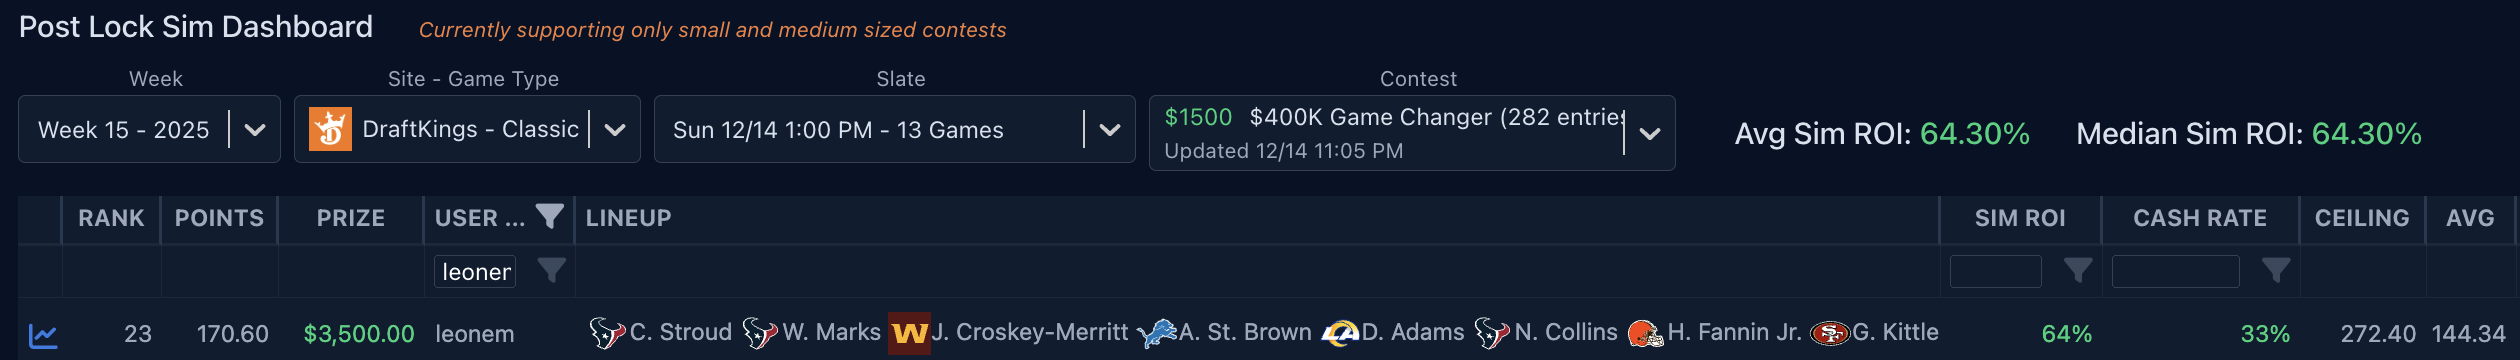
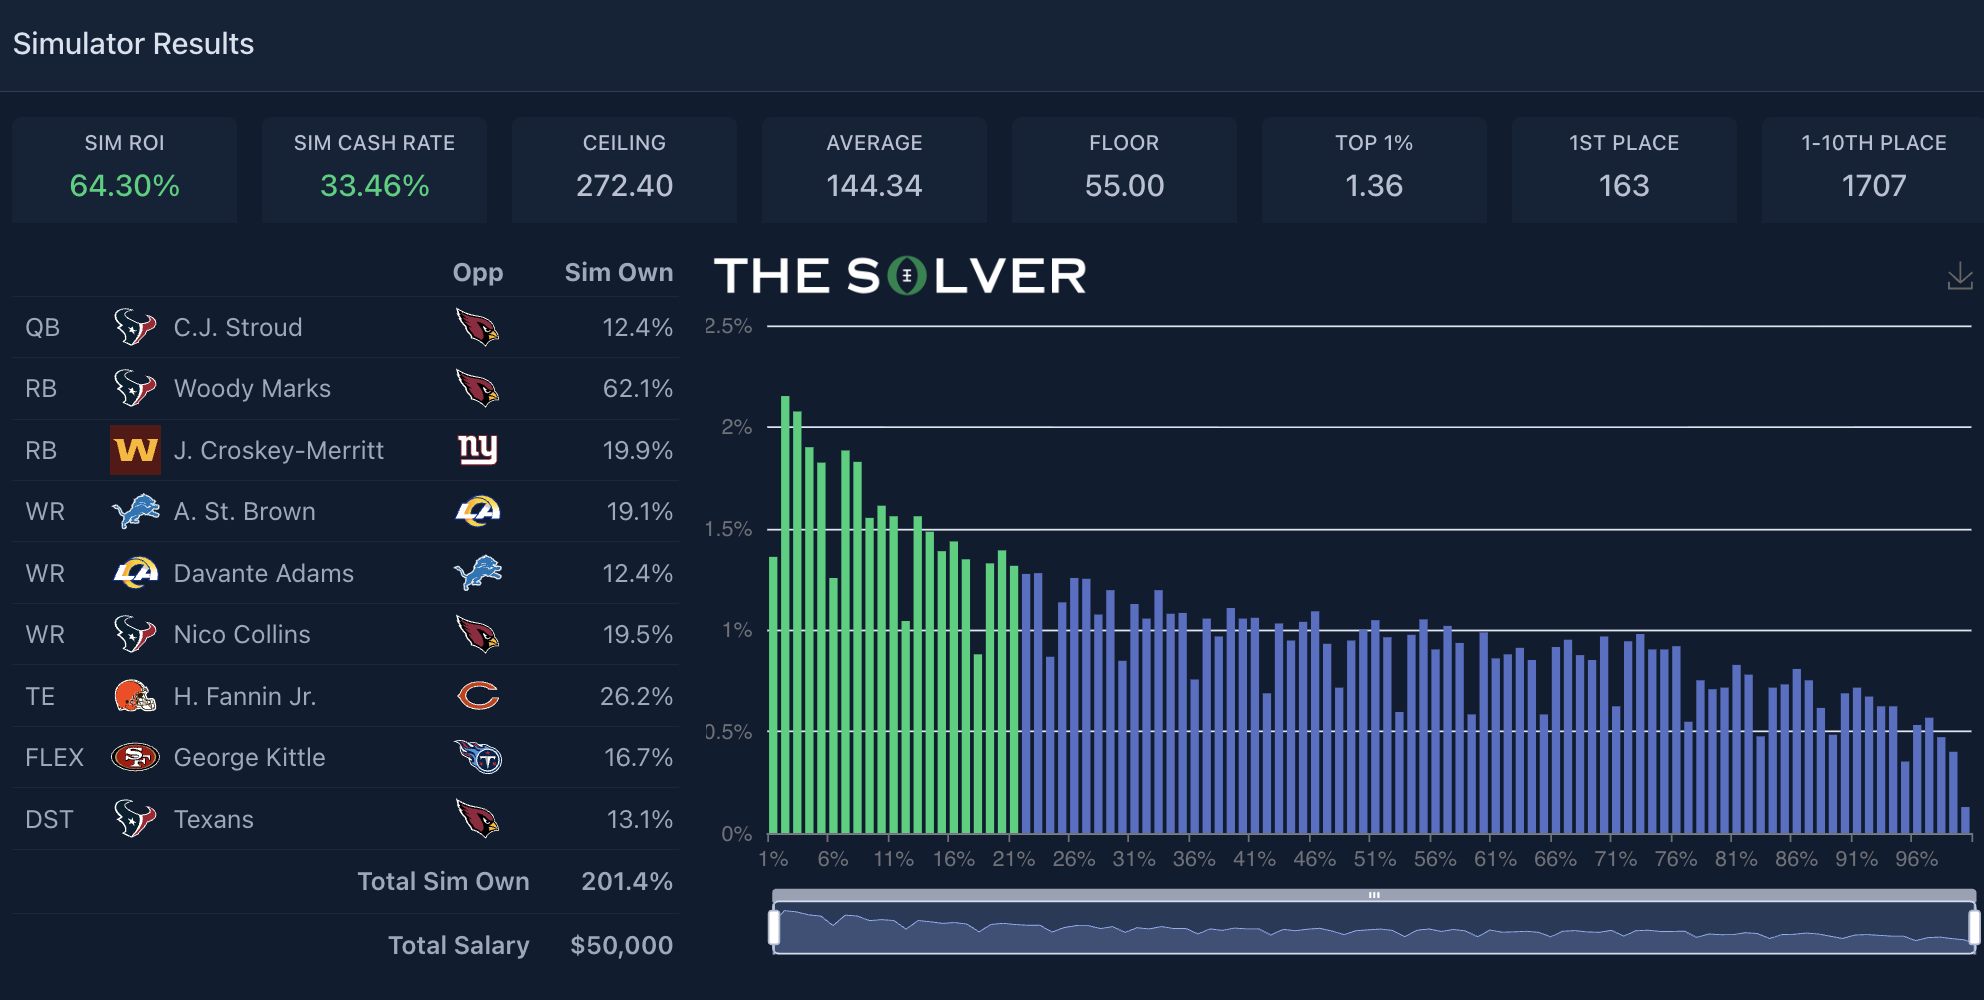
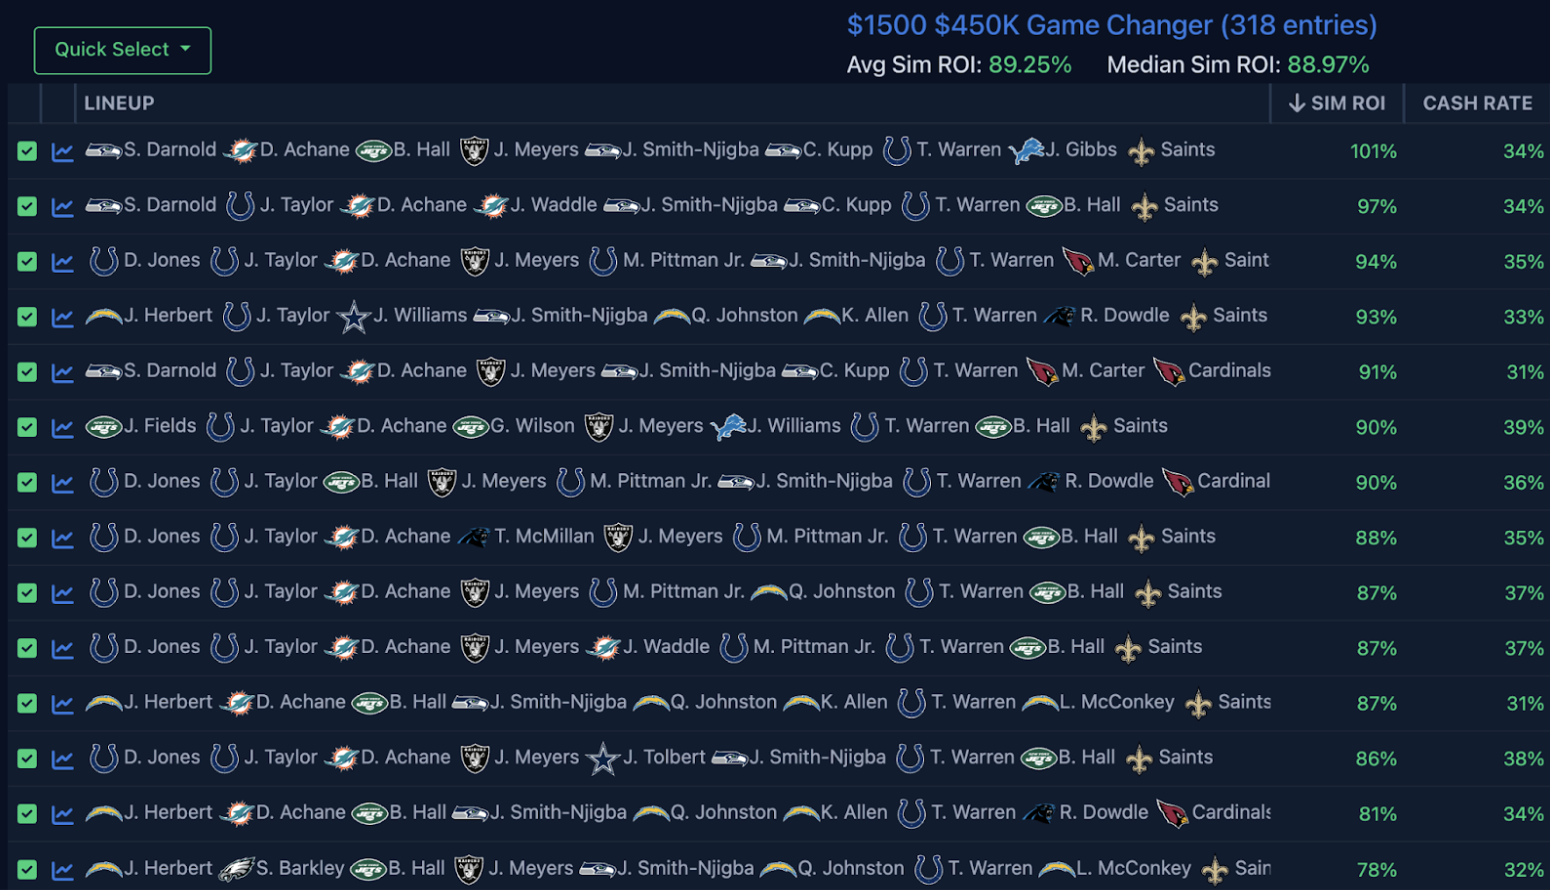
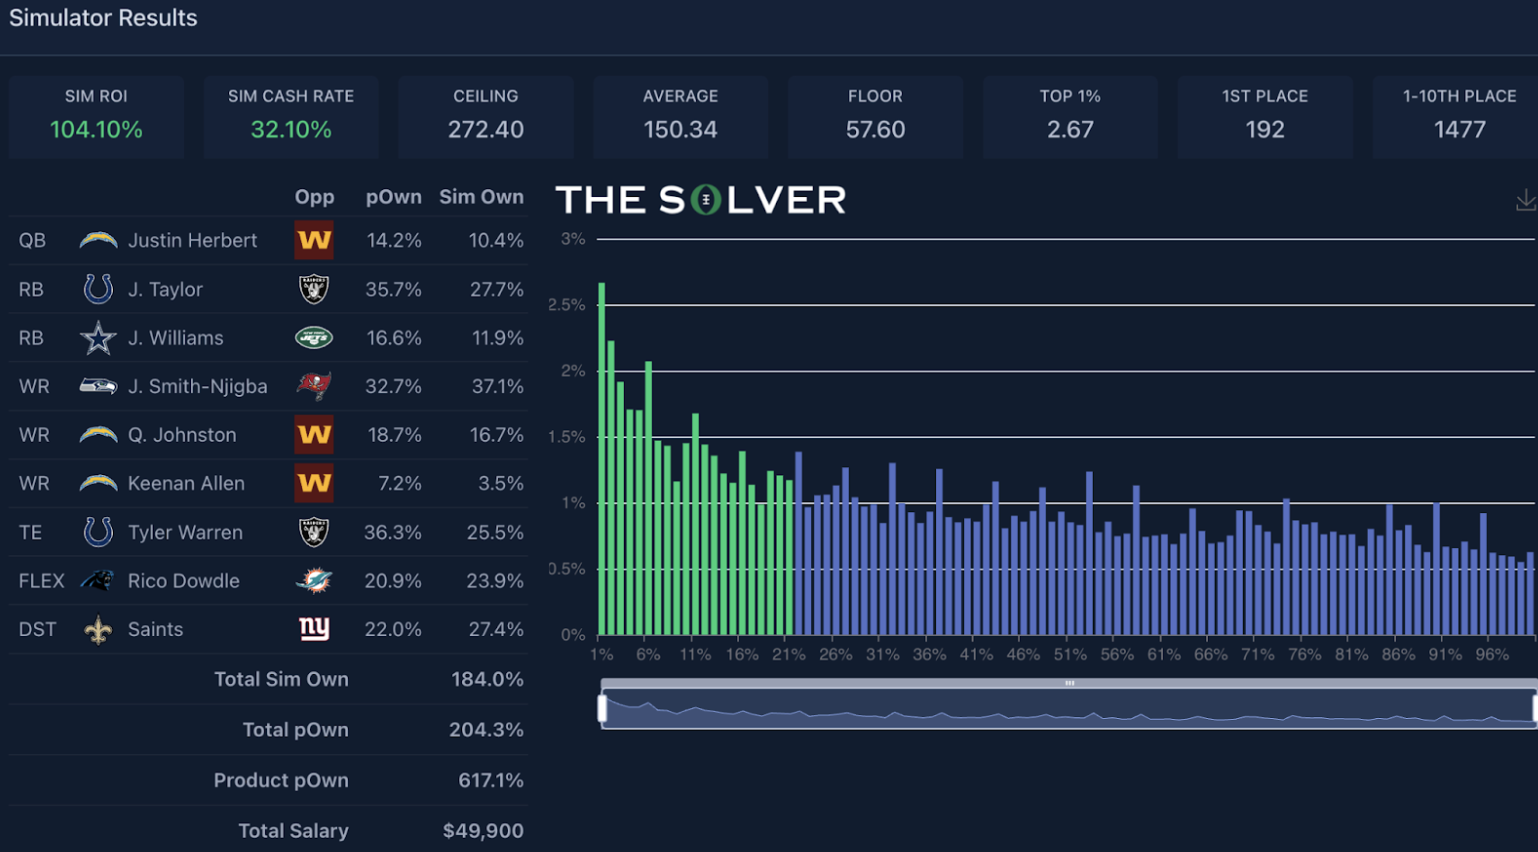
Here’s an example of a lineup I played in the Game Changer in Week 15:
The goal of launching these post-lock sims was and is for people to:
- Evaluate how strong the lineups they are playing are
- Analyze what actual winning and losing lineups look like
- Analyze what the highest and lowest sim ROI lineups look like
However, it is admittedly confusing for a lot of users to generate value from the post-lock sims. People are unsure how well calibrated the sim results are. Does the post-lock sim ROI actually mean anything?
This confusion is amplified by the noise of the results. We commonly get asked questions that boil down to one thing, depending on the results of a given week:
“Why do teams that sim well perform poorly, and teams that actually win sim poorly?”
It’s easy to give the stock answer to people that the sims are measuring the full range of outcomes while the actual results represent only a single outcome, which, of course, introduces noise. In other words, variance.
And while I believe that to be true, I wanted to have a firmer, data-backed answer for people heading into next year. Plus, my own results this past season were poor. It was one of my worst ROI seasons since I’ve been with ETR, despite routinely creating lineups that simulated positively post-lock.
Do our post-lock sims provide any signal?
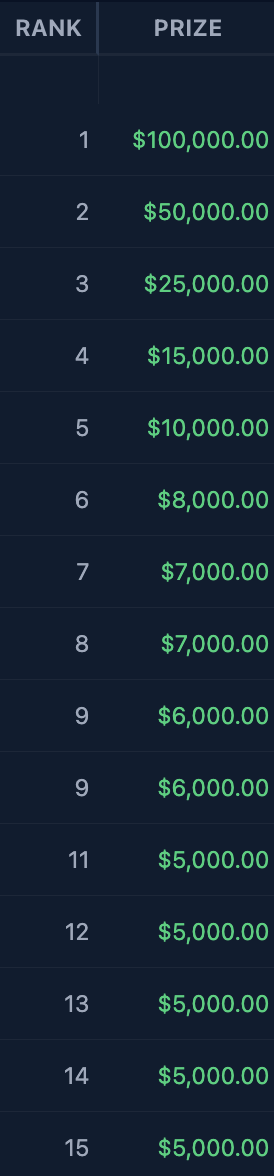
I decided to closely evaluate the main-slate post-lock sims in the Game Changer since we started offering them on The Solver. That encompassed Weeks 4-21 of this past NFL season and Weeks 2-21 of the previous NFL season. The Game Changer is a single-entry contest with a $1,500 buy-in and roughly 275 entrants each week. The payout structure is a little bit top-heavy most weeks, with usually a tick under 22% of the field getting paid out (minimum payout is $2,500). Pictured below is the payout structure for the top 15 finishers in the Week 15 Game Changer last year, which is typical of this contest:
I chose this contest for a few reasons. For starters, it’s a contest I routinely play. It’s a small-field contest, making it easier to draw out signals between lineups that have a good chance to finish in the top 10 and those that don’t. It’s also a high-stakes contest, which I think adds some credibility to this being a legitimate contest to deconstruct.
All in all, while the sample size is still small (35 contests), I felt this contest had a good mix of being one I’m familiar with, one that is in the wheelhouse (payout- and size-wise) of a lot of contests that our subscribers play, and one that is credible to evaluate.
There are better ways to more robustly measure the calibration of all of our sims, but for this article, I thought it was important to use the actual post-lock sims subscribers are using and to make as much sense of them as I could.
Some quick housekeeping on what the sims do and don’t do before we get into the results:
What our sims account for:
- The payout structure of the contest
- The actual field lineups
- The fantasy-point distributions and correlations of each lineup (as generated by ETR game simulations)
What our sims don’t account for:
- ETR mean projections being wrong
- Changes to projections after initial main-slate lock
- Late-swap dynamics (only the final actual lineups are considered)
Another point I want to make is that the sims are not trying to predict the future. I know I am being pedantic here, but it’s important to note this because there can be confusion over what the sims are trying to accomplish. If a player sims well, it does not necessarily mean the sims think that player is going to have a great performance. The sims are applying a distribution to that player’s fantasy points stemming from our mean projection. The sims may “like” that player because he has a right tail that moves the needle in terms of a fantasy team’s ability to win the contest, or because that player’s ownership is too low.
As an extreme example, if I played a 10-person satellite and nine out of 10 people played Josh Jacobs at $6,800 with a 17.6-point projection but I was the only one who played De’Von Achane at the same price and projection, the sims are likely going to tell me I have a positive ROI team over the long run. This does not mean the sims are saying Achane is more likely to succeed than Jacobs; just that it happens frequently enough to allow my team to win a good amount more than it would based on pure randomness.
In a vacuum, the sims aren’t determining what will happen. What they are saying is, if the ETR projections, distributions, and correlations are accurate, on average, these players, combinations, or specific lineups are more likely to win more money than other players, combinations, or specific lineups. But even the worst lineups, according to our sims, still are going to win some of the time, and there’s no way for us to know which exact sim iteration will occur in reality this time (or else we’d be rich).
Going back to the Week 15 Game Changer, since I posted my team above that simulated well and managed a decent cash, we see the winner of the contest actually had a team that simulated poorly on average (-20% ROI):

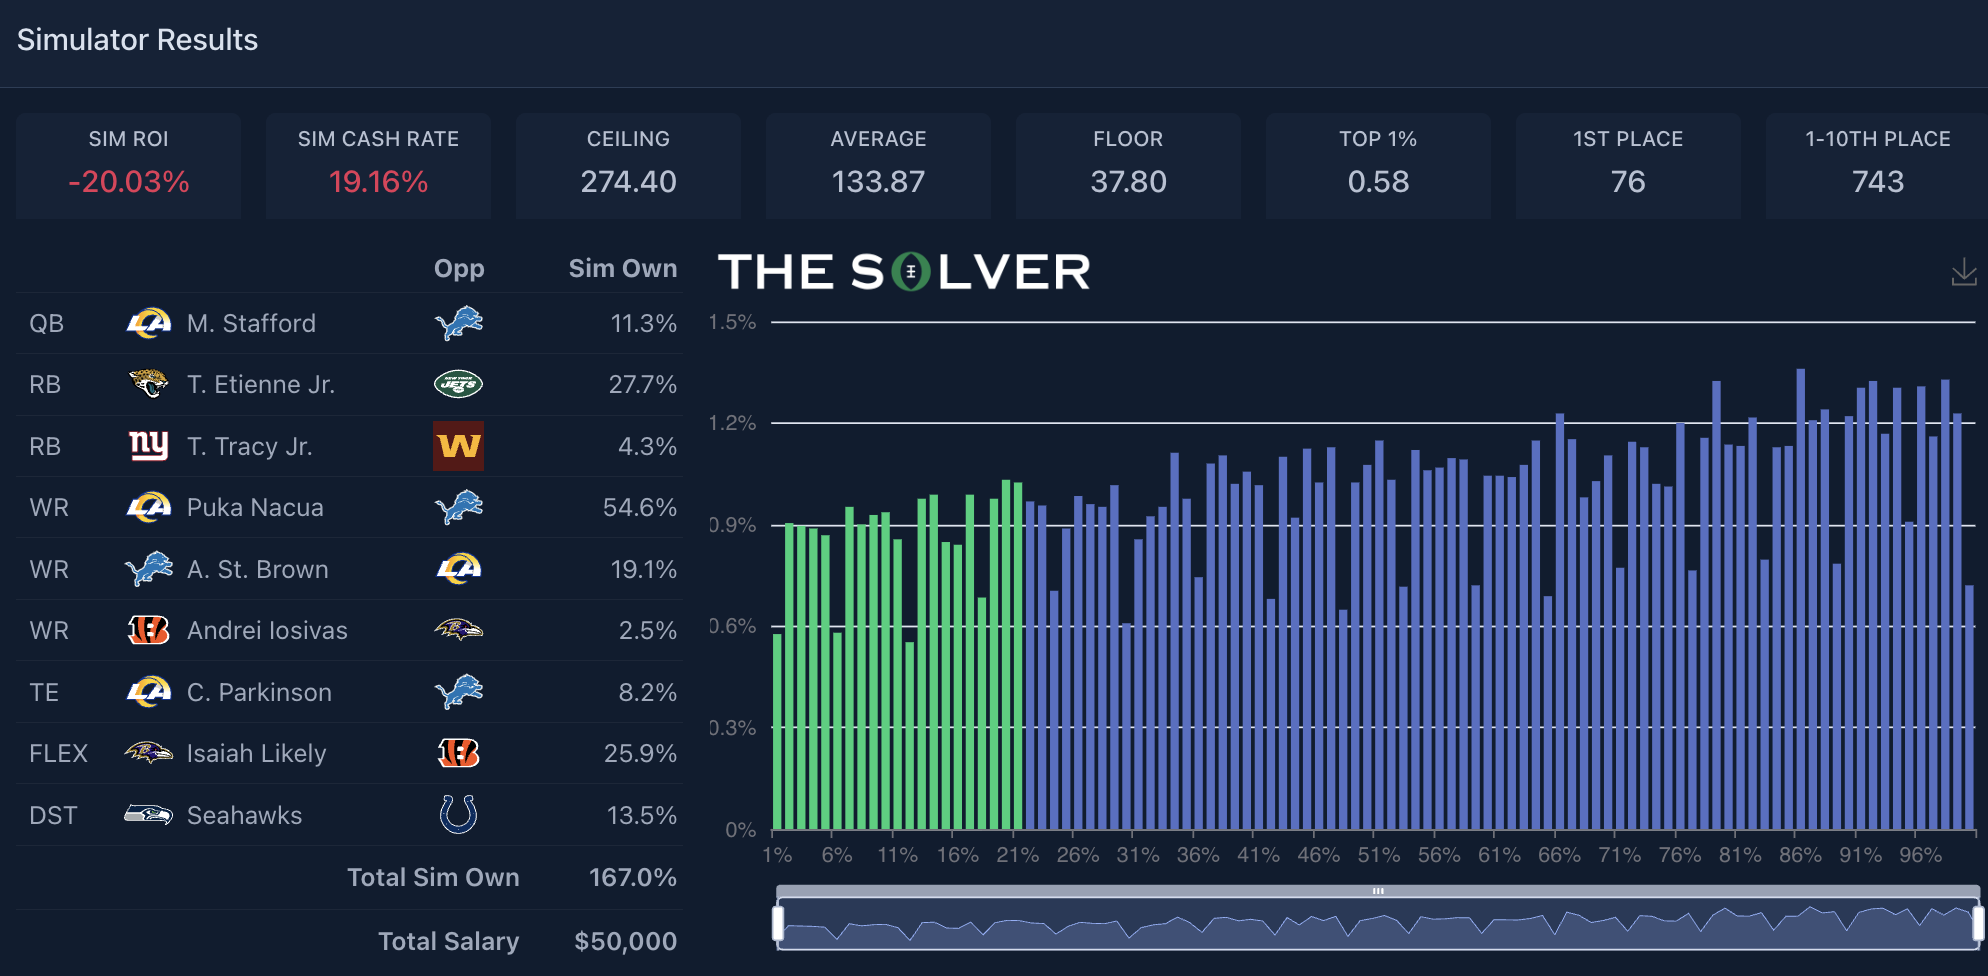
Our sims surprisingly had this team winning 76 times (0.304% of the time), which isn’t too far off from complete randomness (0.354% of the time). Specifically, it’s unlikely our sims are so precise that we have the exact win rate on this team perfect, and that’s going to impact the ROI meaningfully, given that no single-place outcome has a bigger impact on a lineup’s ROI than first place. As you’ll see later on, the sims are pretty well calibrated when you look at lineups in the aggregate, but the point here is that negative ROI teams are going to win the actual contests a fair amount of the time. Heck, they even win in the very sims that tell you the team is negative ROI at a higher rate than you’d probably expect, given the sim ROI.
The bottom line is that pretty much any team can win on a given week. The sims are telling us the odds that that happens over the long run and how much it moves the needle. We may overrate our own innate ability to do this. For example, on Establish The Million, I might say it’s a bad idea to go contrarian at RB on a given week because the opportunity cost is too high. While I can make a logical argument for that and have a good feel for it, given my experience, the devil is in the details. This is where the sims help to support the qualitative reasoning with quantitative validation.
Do the sims matter?
Okay, enough with the caveats and explanations, it’s time to finally answer the question.
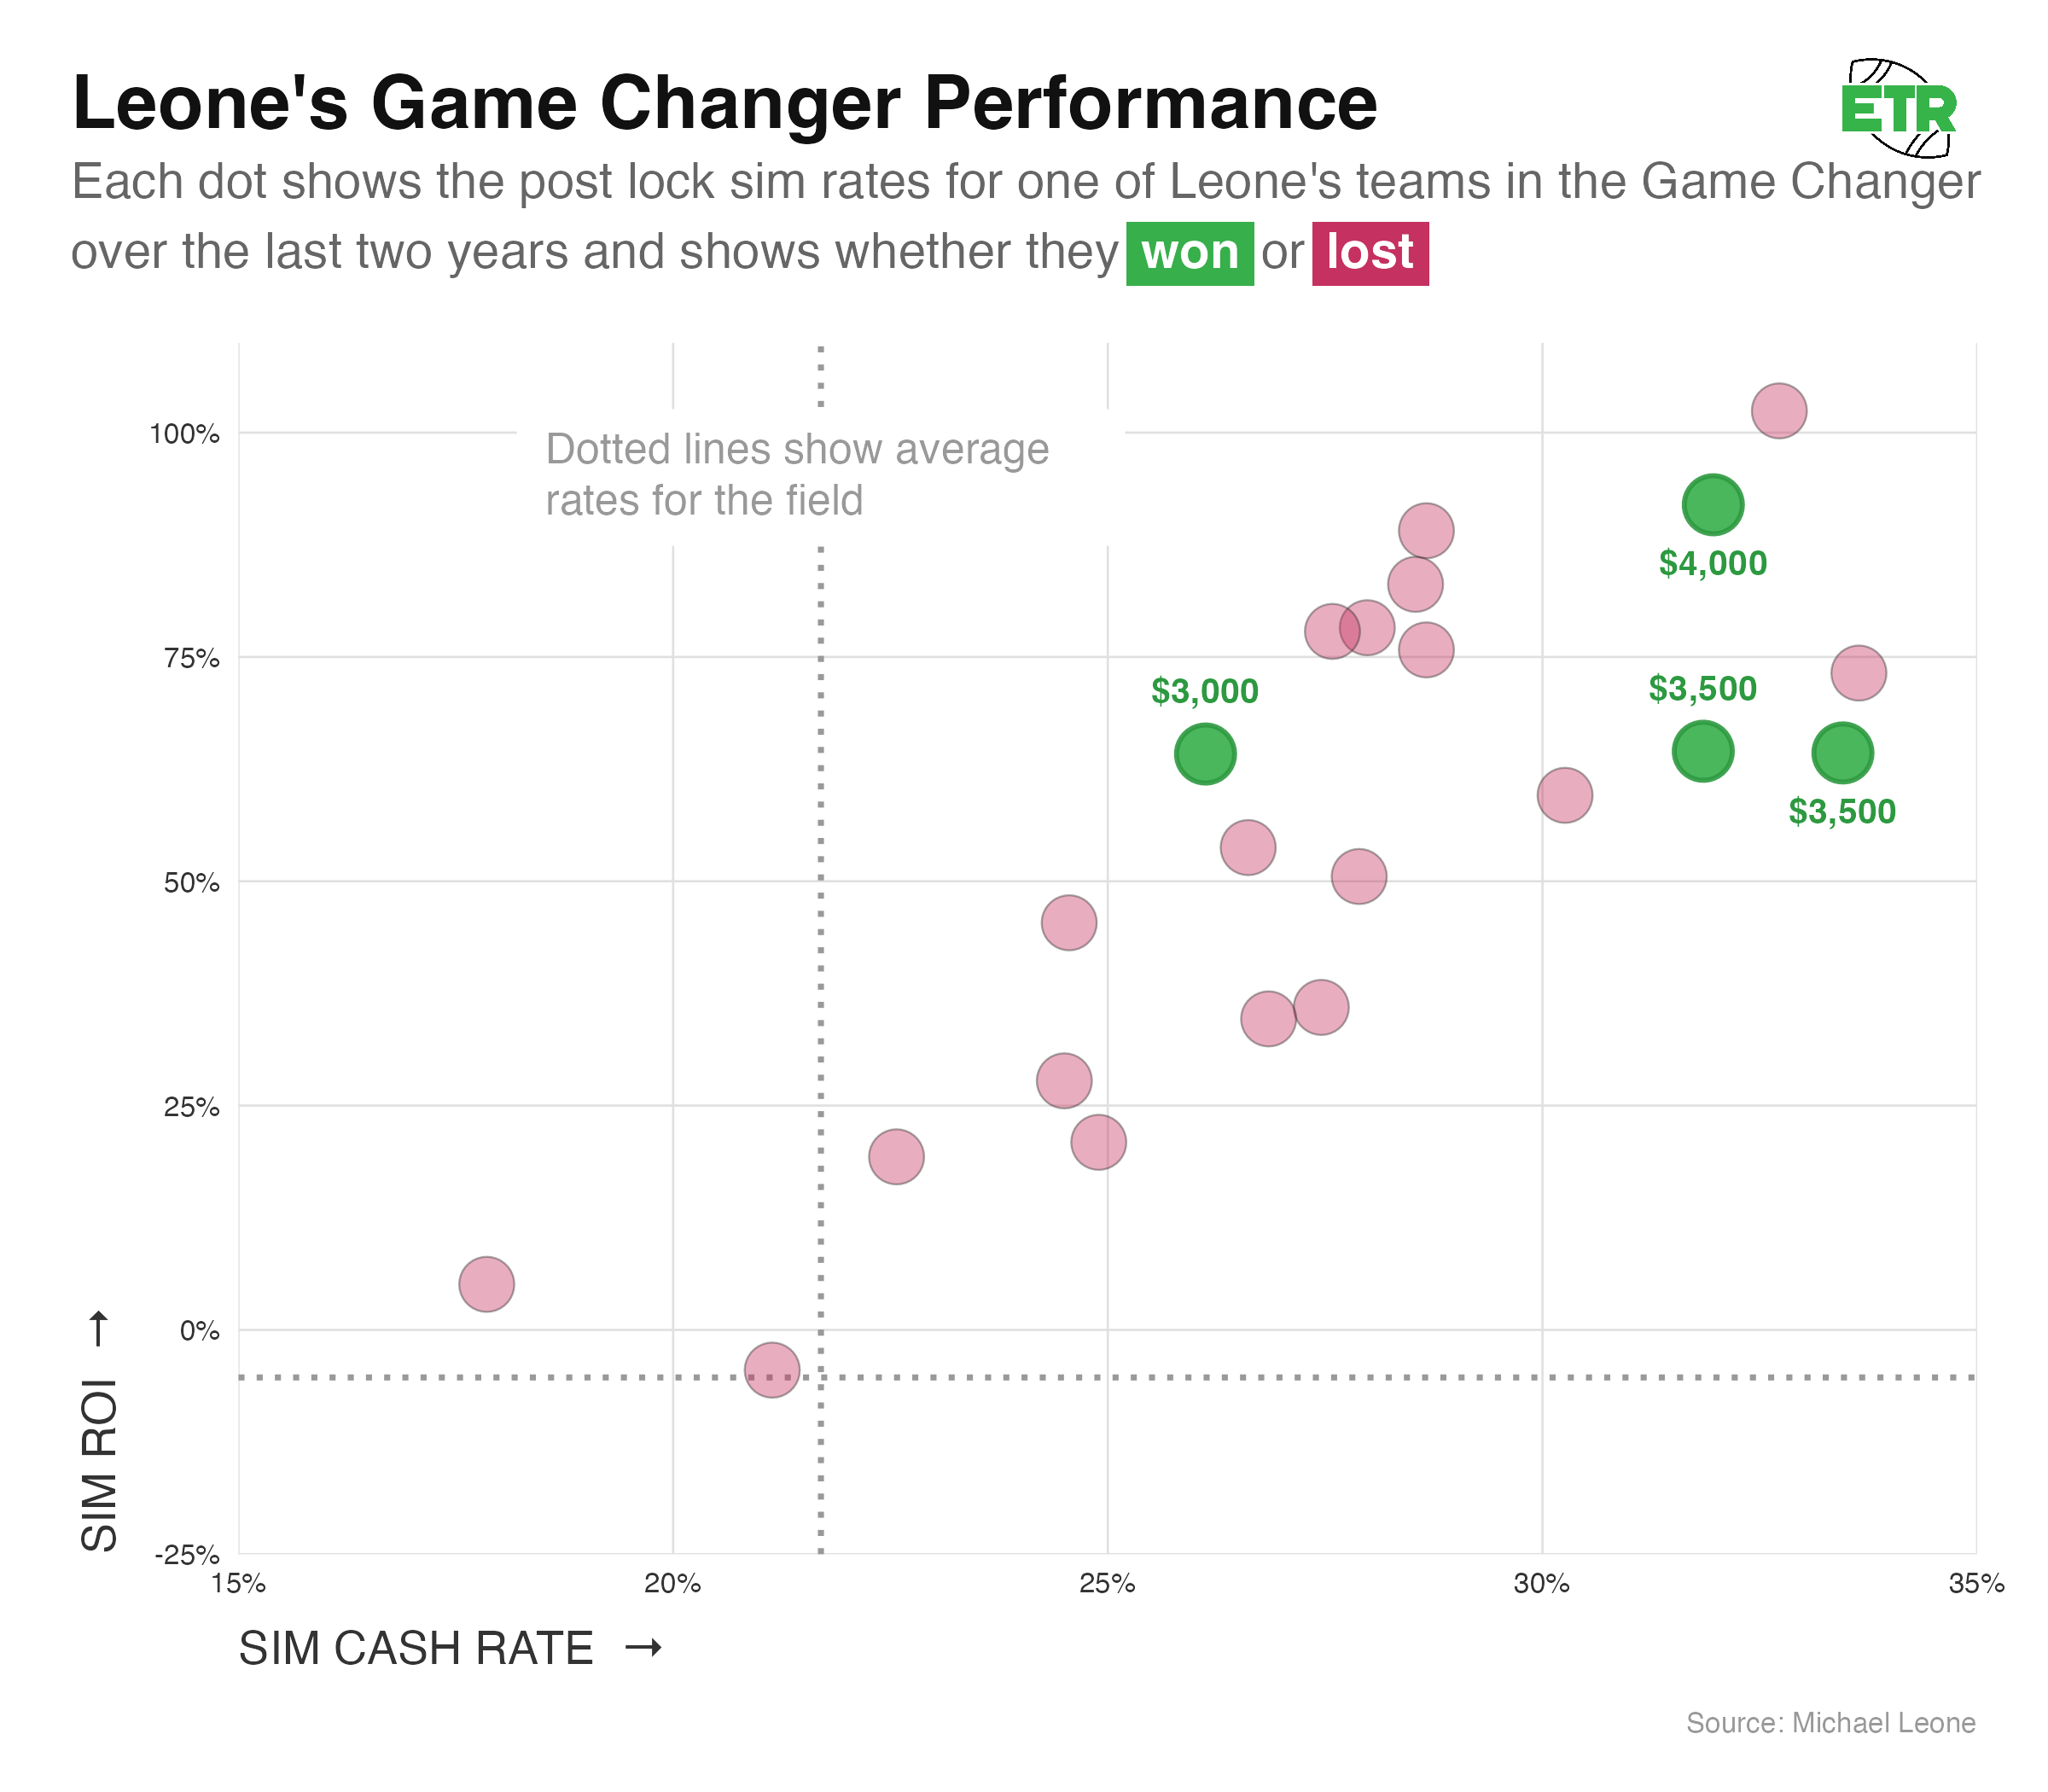
Let’s start narrowly by evaluating the winning lineups of the 35 Game Changer contests we have post-lock sims for.
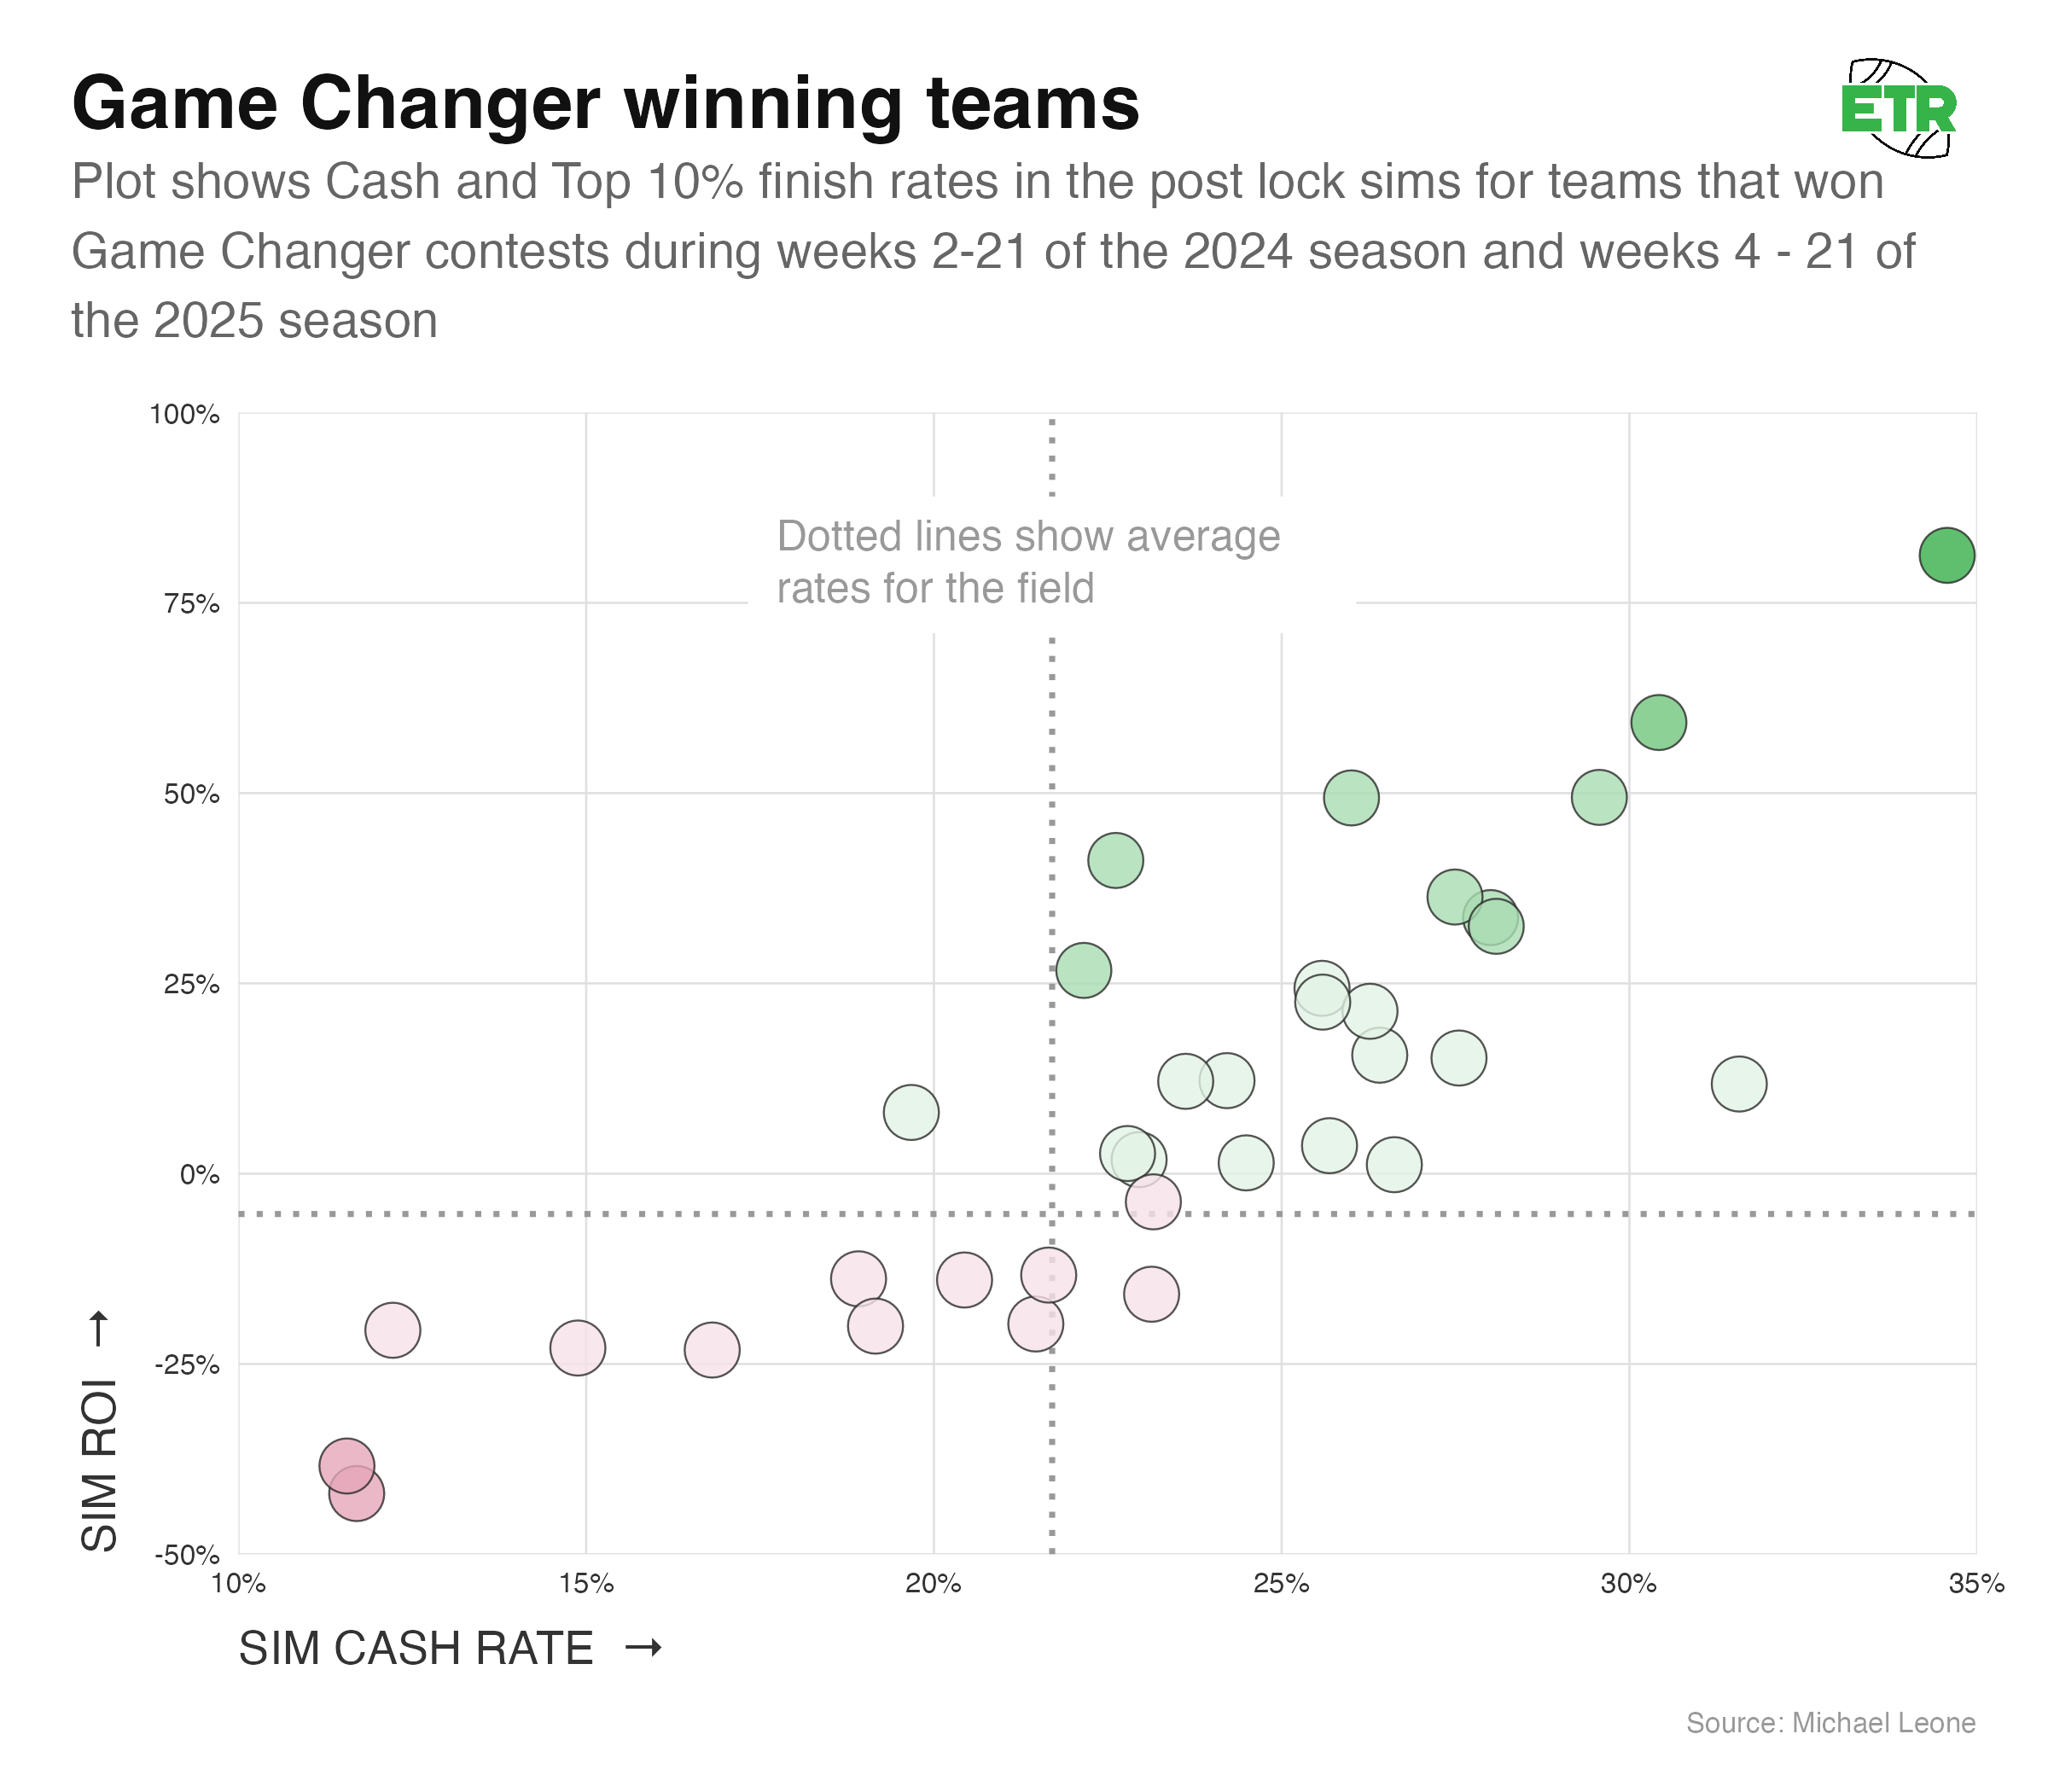
At first glance, the group of winners may seem somewhat random. You see some teams in the top right quadrant, some in the bottom left quadrant, and a bit of clustering around the break-even points. A closer analysis reveals more of a pattern, though.
The average sim ROI of the 35 different winners was +9.0% (random expectation of -5.3%), and 23 of the 35 winning lineups had a positive sim ROI (65.7%). None of this is proof of anything, given the simplicity of this evaluation and the sample size, but I do want to point out that more positive-simulating teams won than not. That might seem like simply being on the right side of a coin flip, but we’re now getting to another reason why people may draw the wrong lessons when a negative-simulating team wins.
The field is biased. Given the rake on this contest, the average ROI of a team is -5.3%, and 60% of all lineups simulated negatively. So, that 65.7% of positive-simulating teams winning could be put another way: A positively-simulated team was 1.65x more likely to win than you’d expect on pure randomness. Conversely, a negatively-simulated team was 0.57x more likely.
Bucketing Teams
While the above results are interesting, they’re also admittedly ripe with variance — just 35 teams over 35 team weeks. To get a better sense of how well the sims are calibrated, I zoomed out and bucketed teams in similar ranges while evaluating the following metrics: cash rate, top-10 rate, and sim ROI.
I bucketed these teams by every five points in simulated cash rate. Every team in the 15 to 20 Sim Cash Rate Bucket had a simulated cash rate in that range (15-20%). Below are all the buckets with a sample size of at least 100 teams:
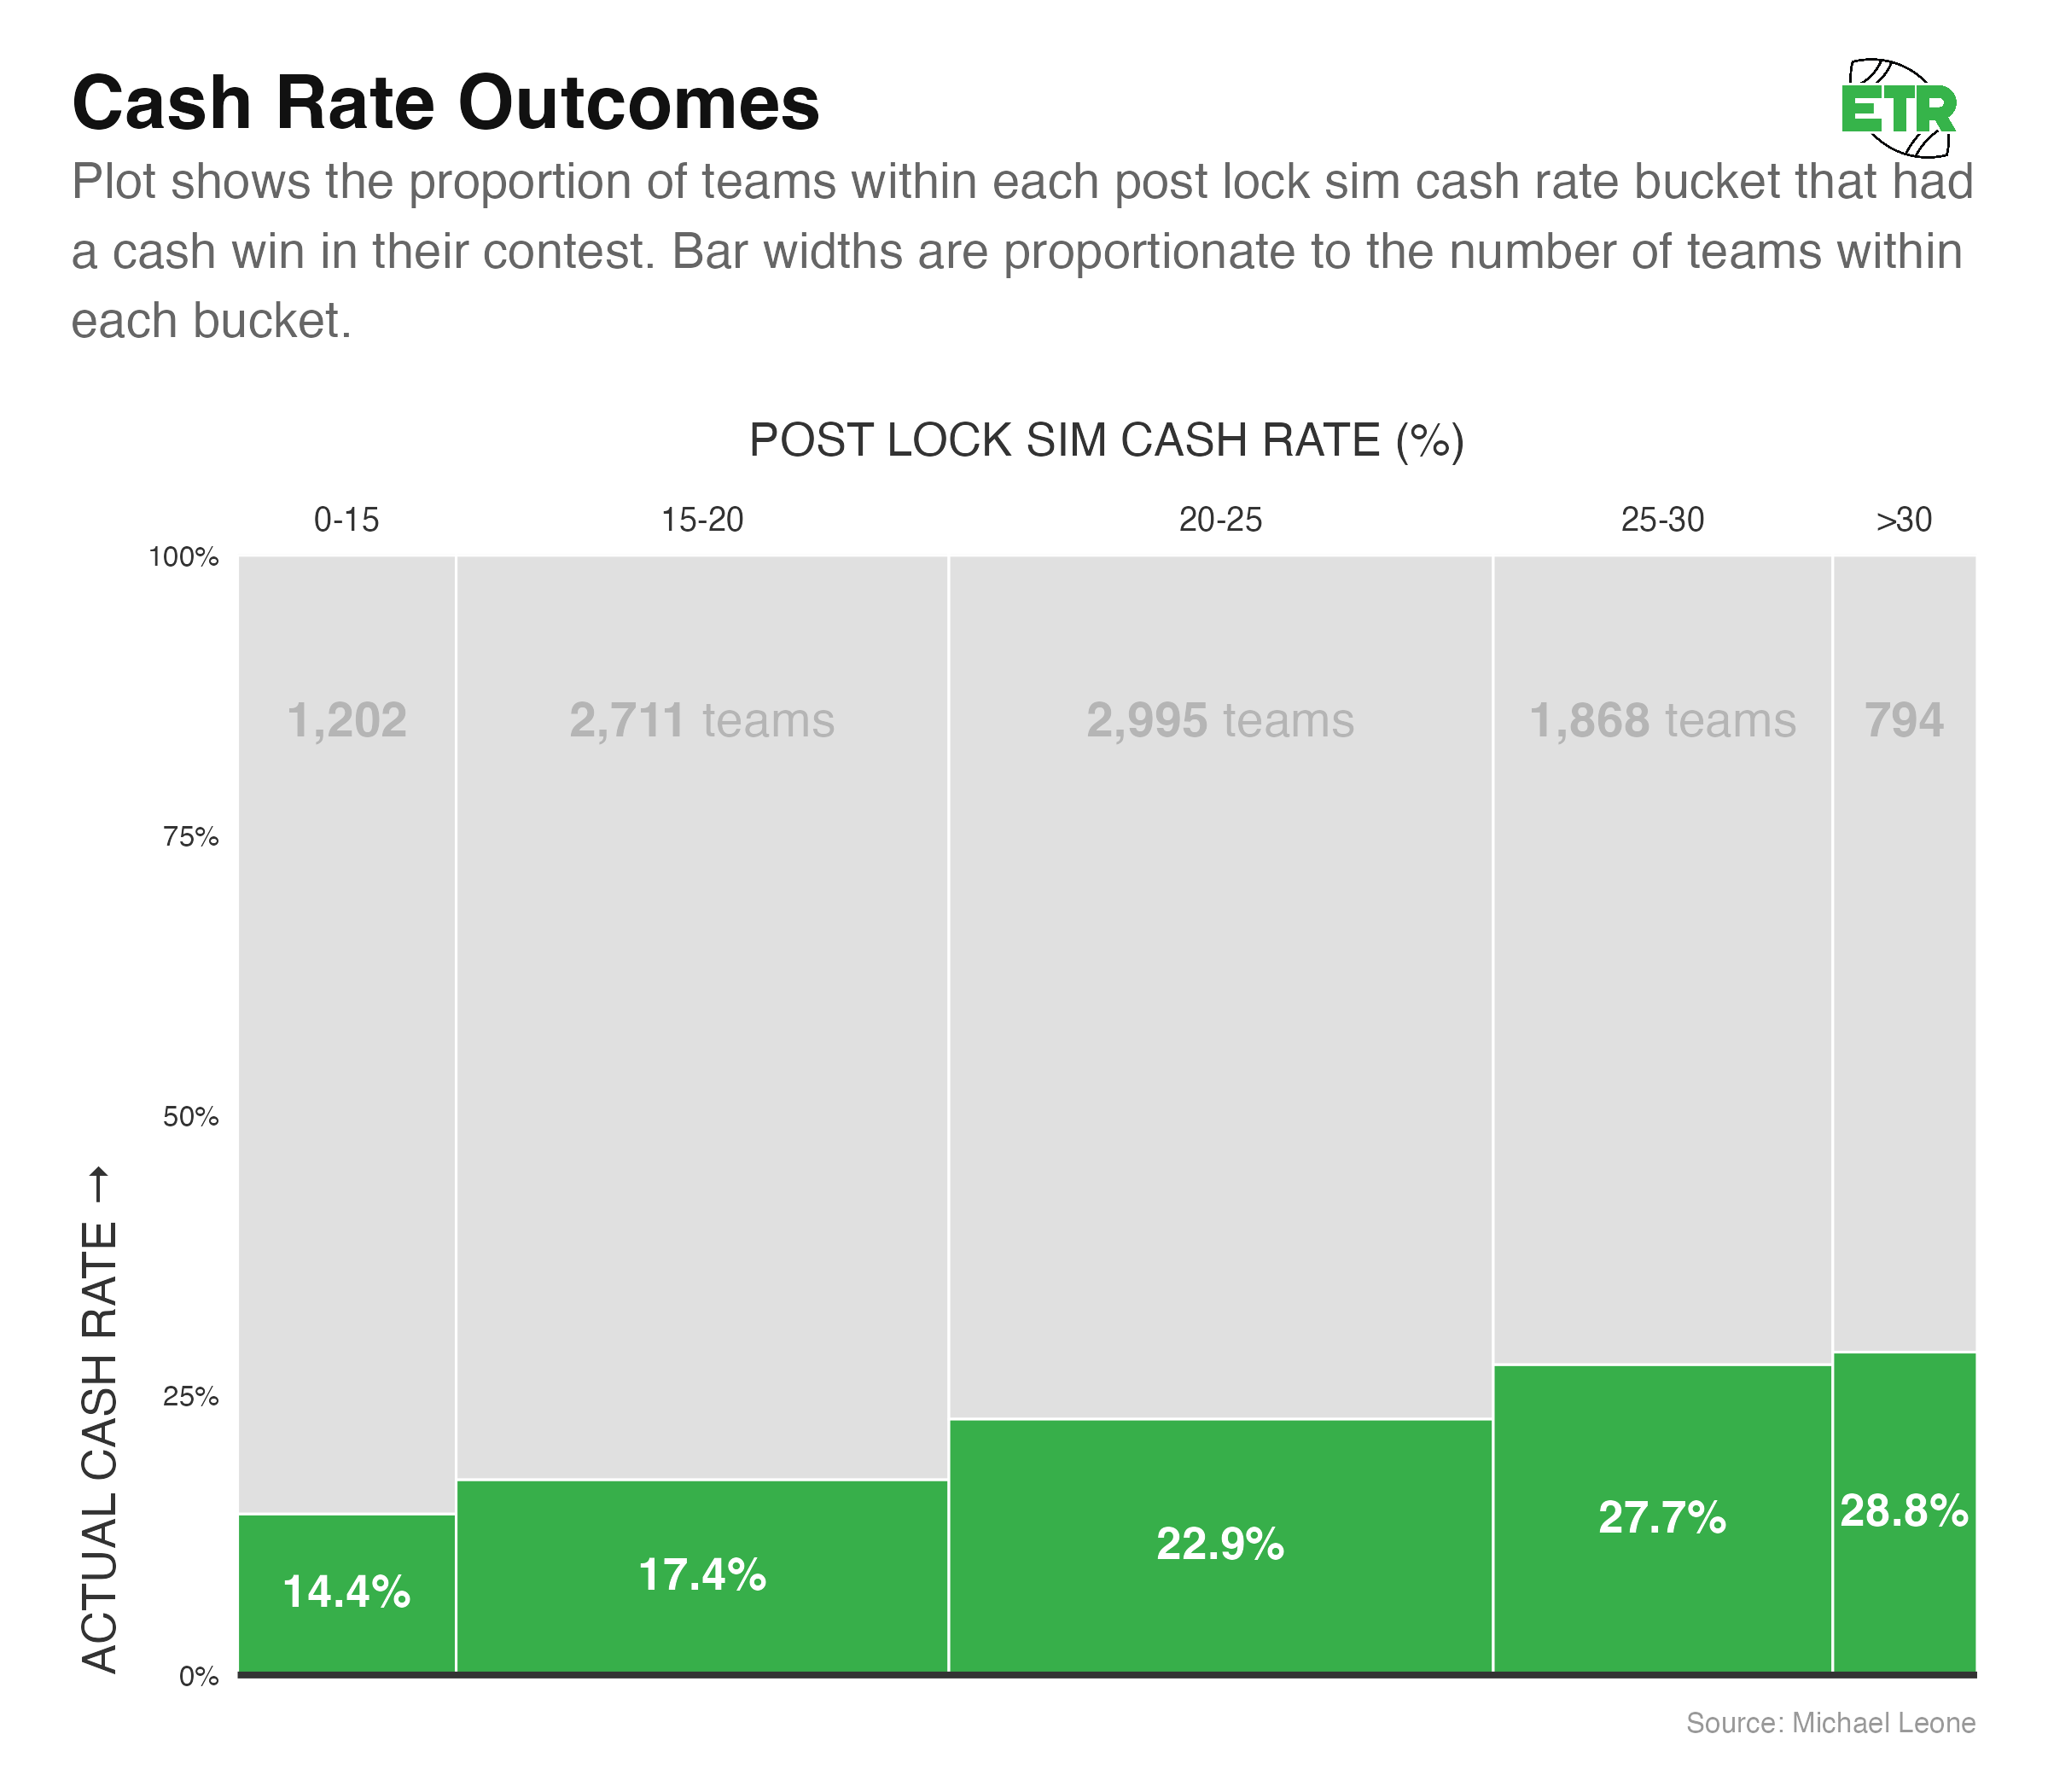
This is a good sign that the cash rate of our sims is well calibrated:
- The average actual cash rate of each bucket falls within the simulated bucket range for four out of five buckets.
- As the simulated cash rates increase for the buckets, the actual cash rates also increase.
If we further decompose the buckets into sizes of three percentage points and remove filtering on sample sizes, this is what it looks like:
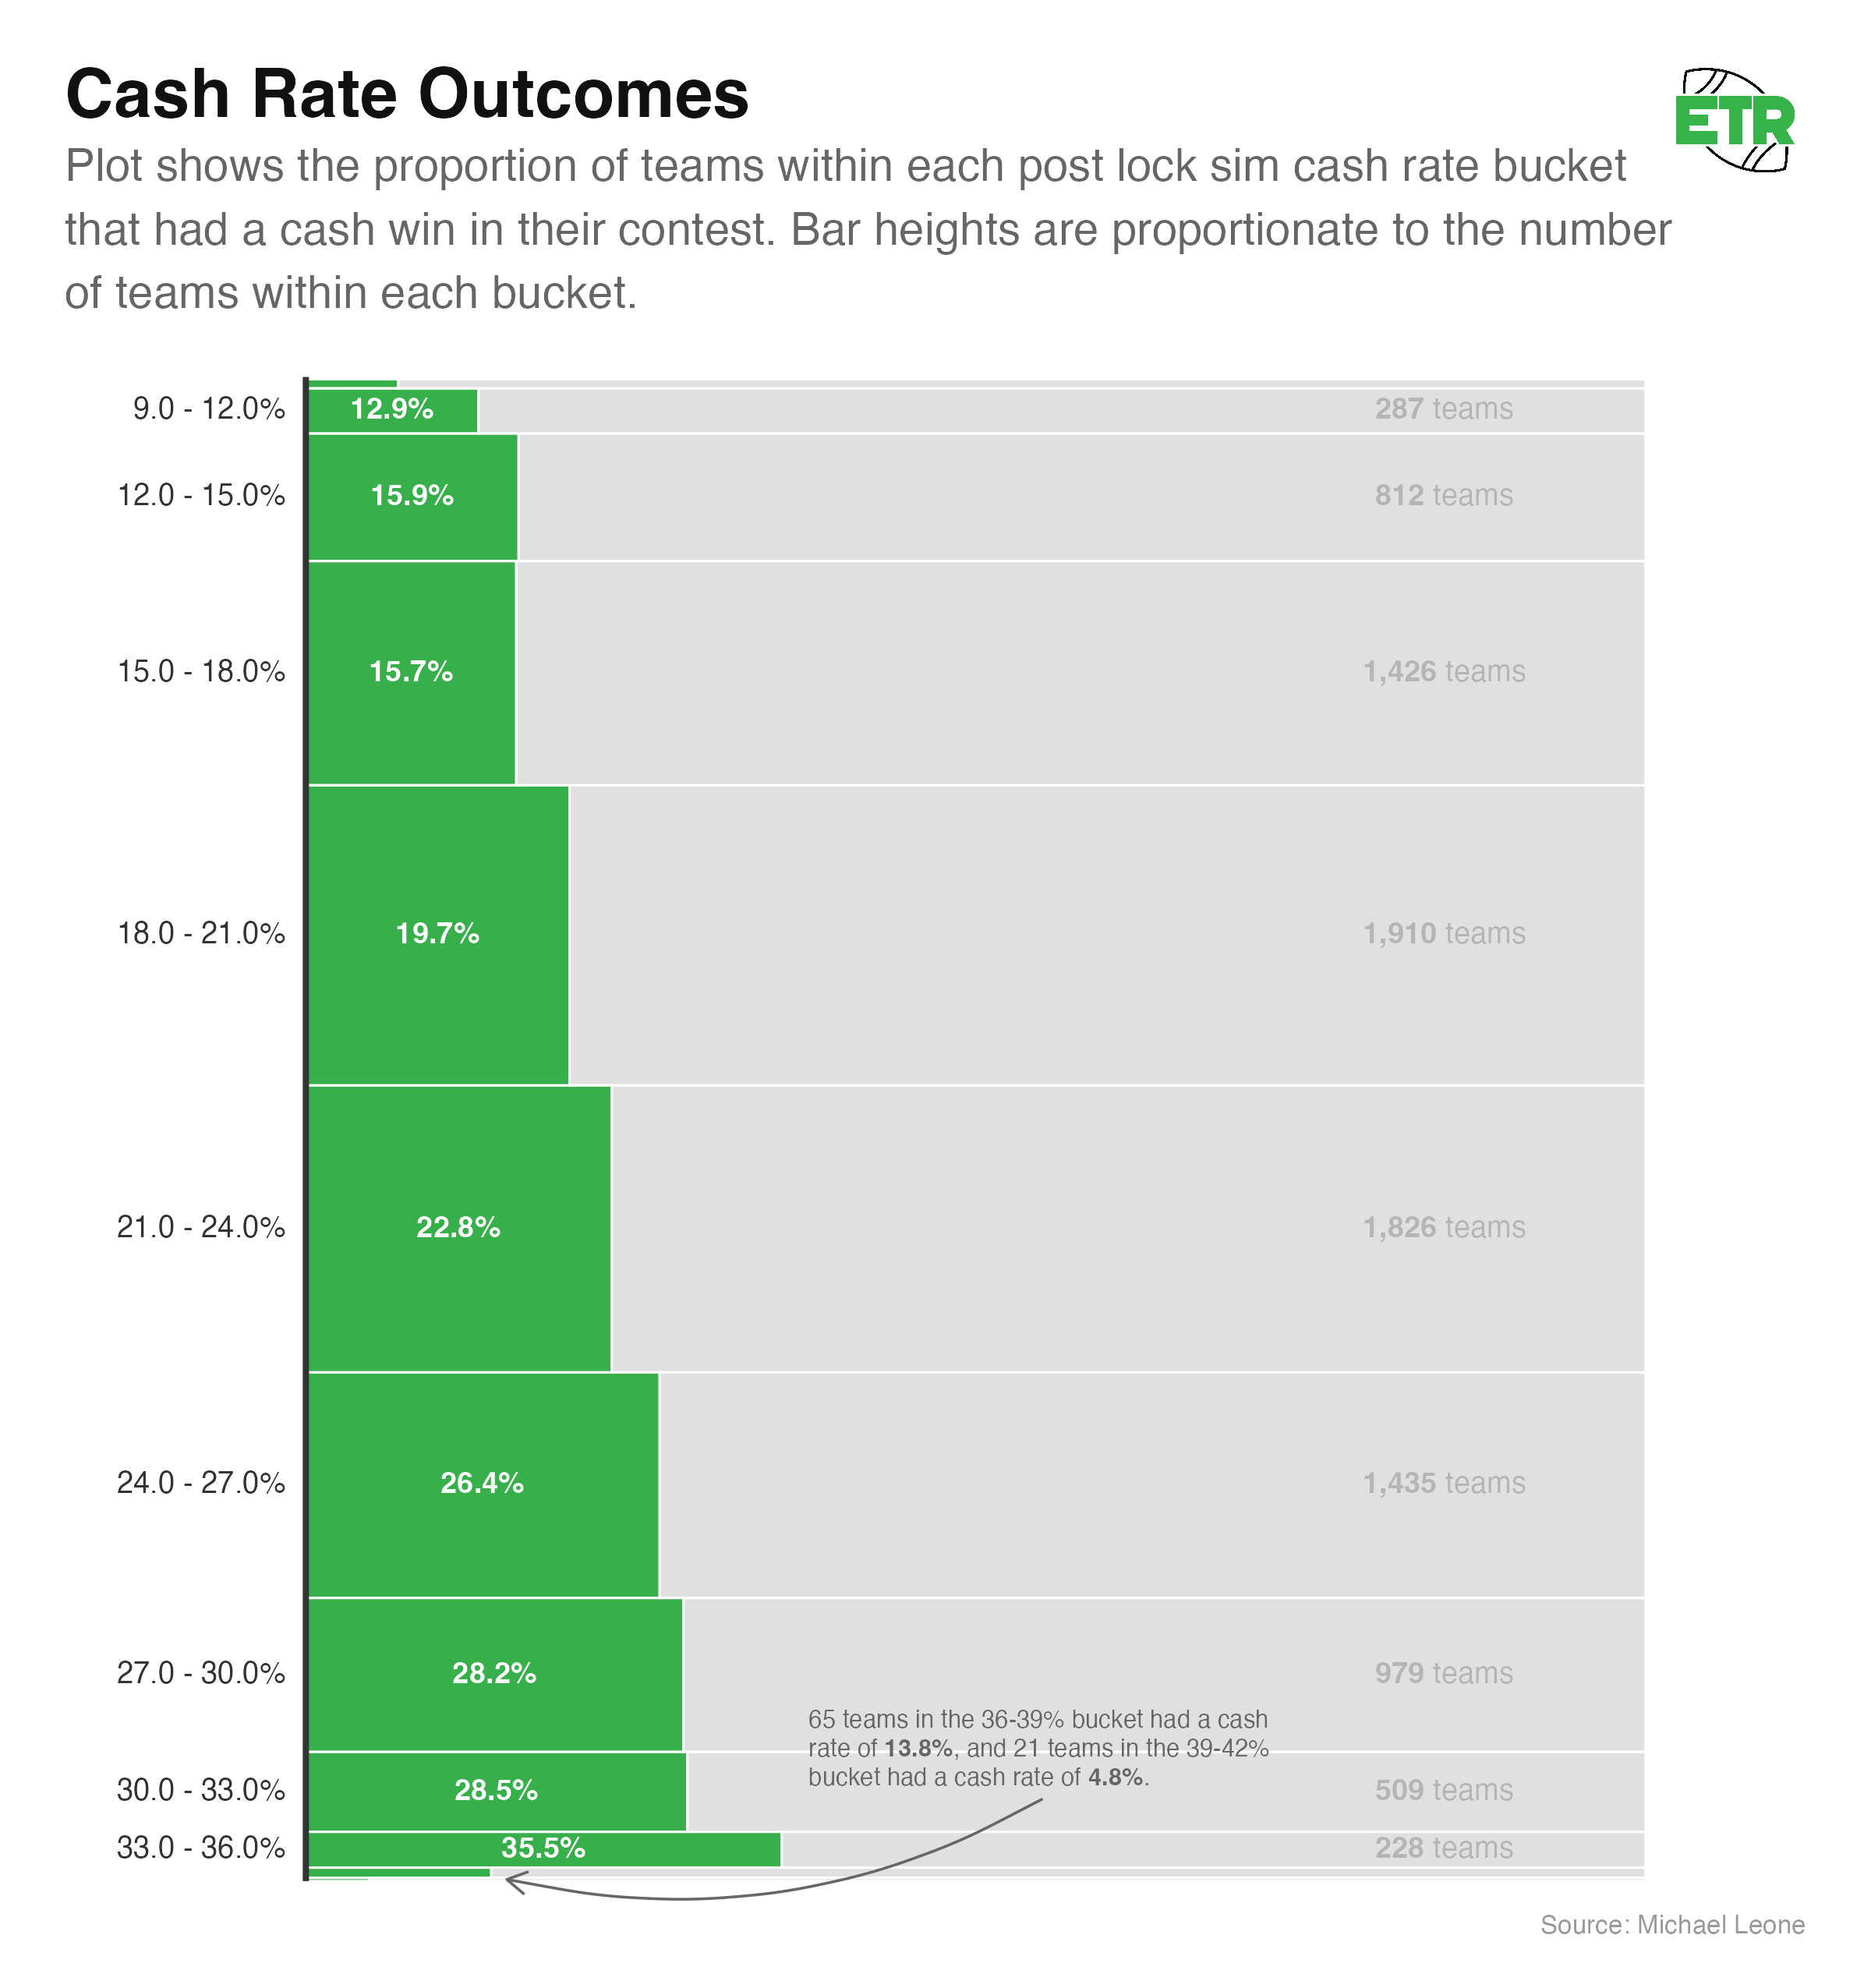
The trend here is clear, though it’s worth noting that the outlier high simulated cash rate teams did not perform well over a small sample size. I doubt these teams are “bad,” but it’s definitely possible we’re overconfident in the teams that sim the *very* best. In the above visual, the two buckets that comprise the bottom green bar represent the top 0.90% of all teams in simulated cash rate.
Top-10 Rate
While cash rate allows us to get a broader sample and is less prone to variance, GPP players make their bank by achieving high-end outcomes. Let’s do a similar analysis on the rate of top-10 finishes. 353 teams (there were a couple of ties that expanded this past 350) out of the 9,570 teams finished with a top-10 finish (3.69%).
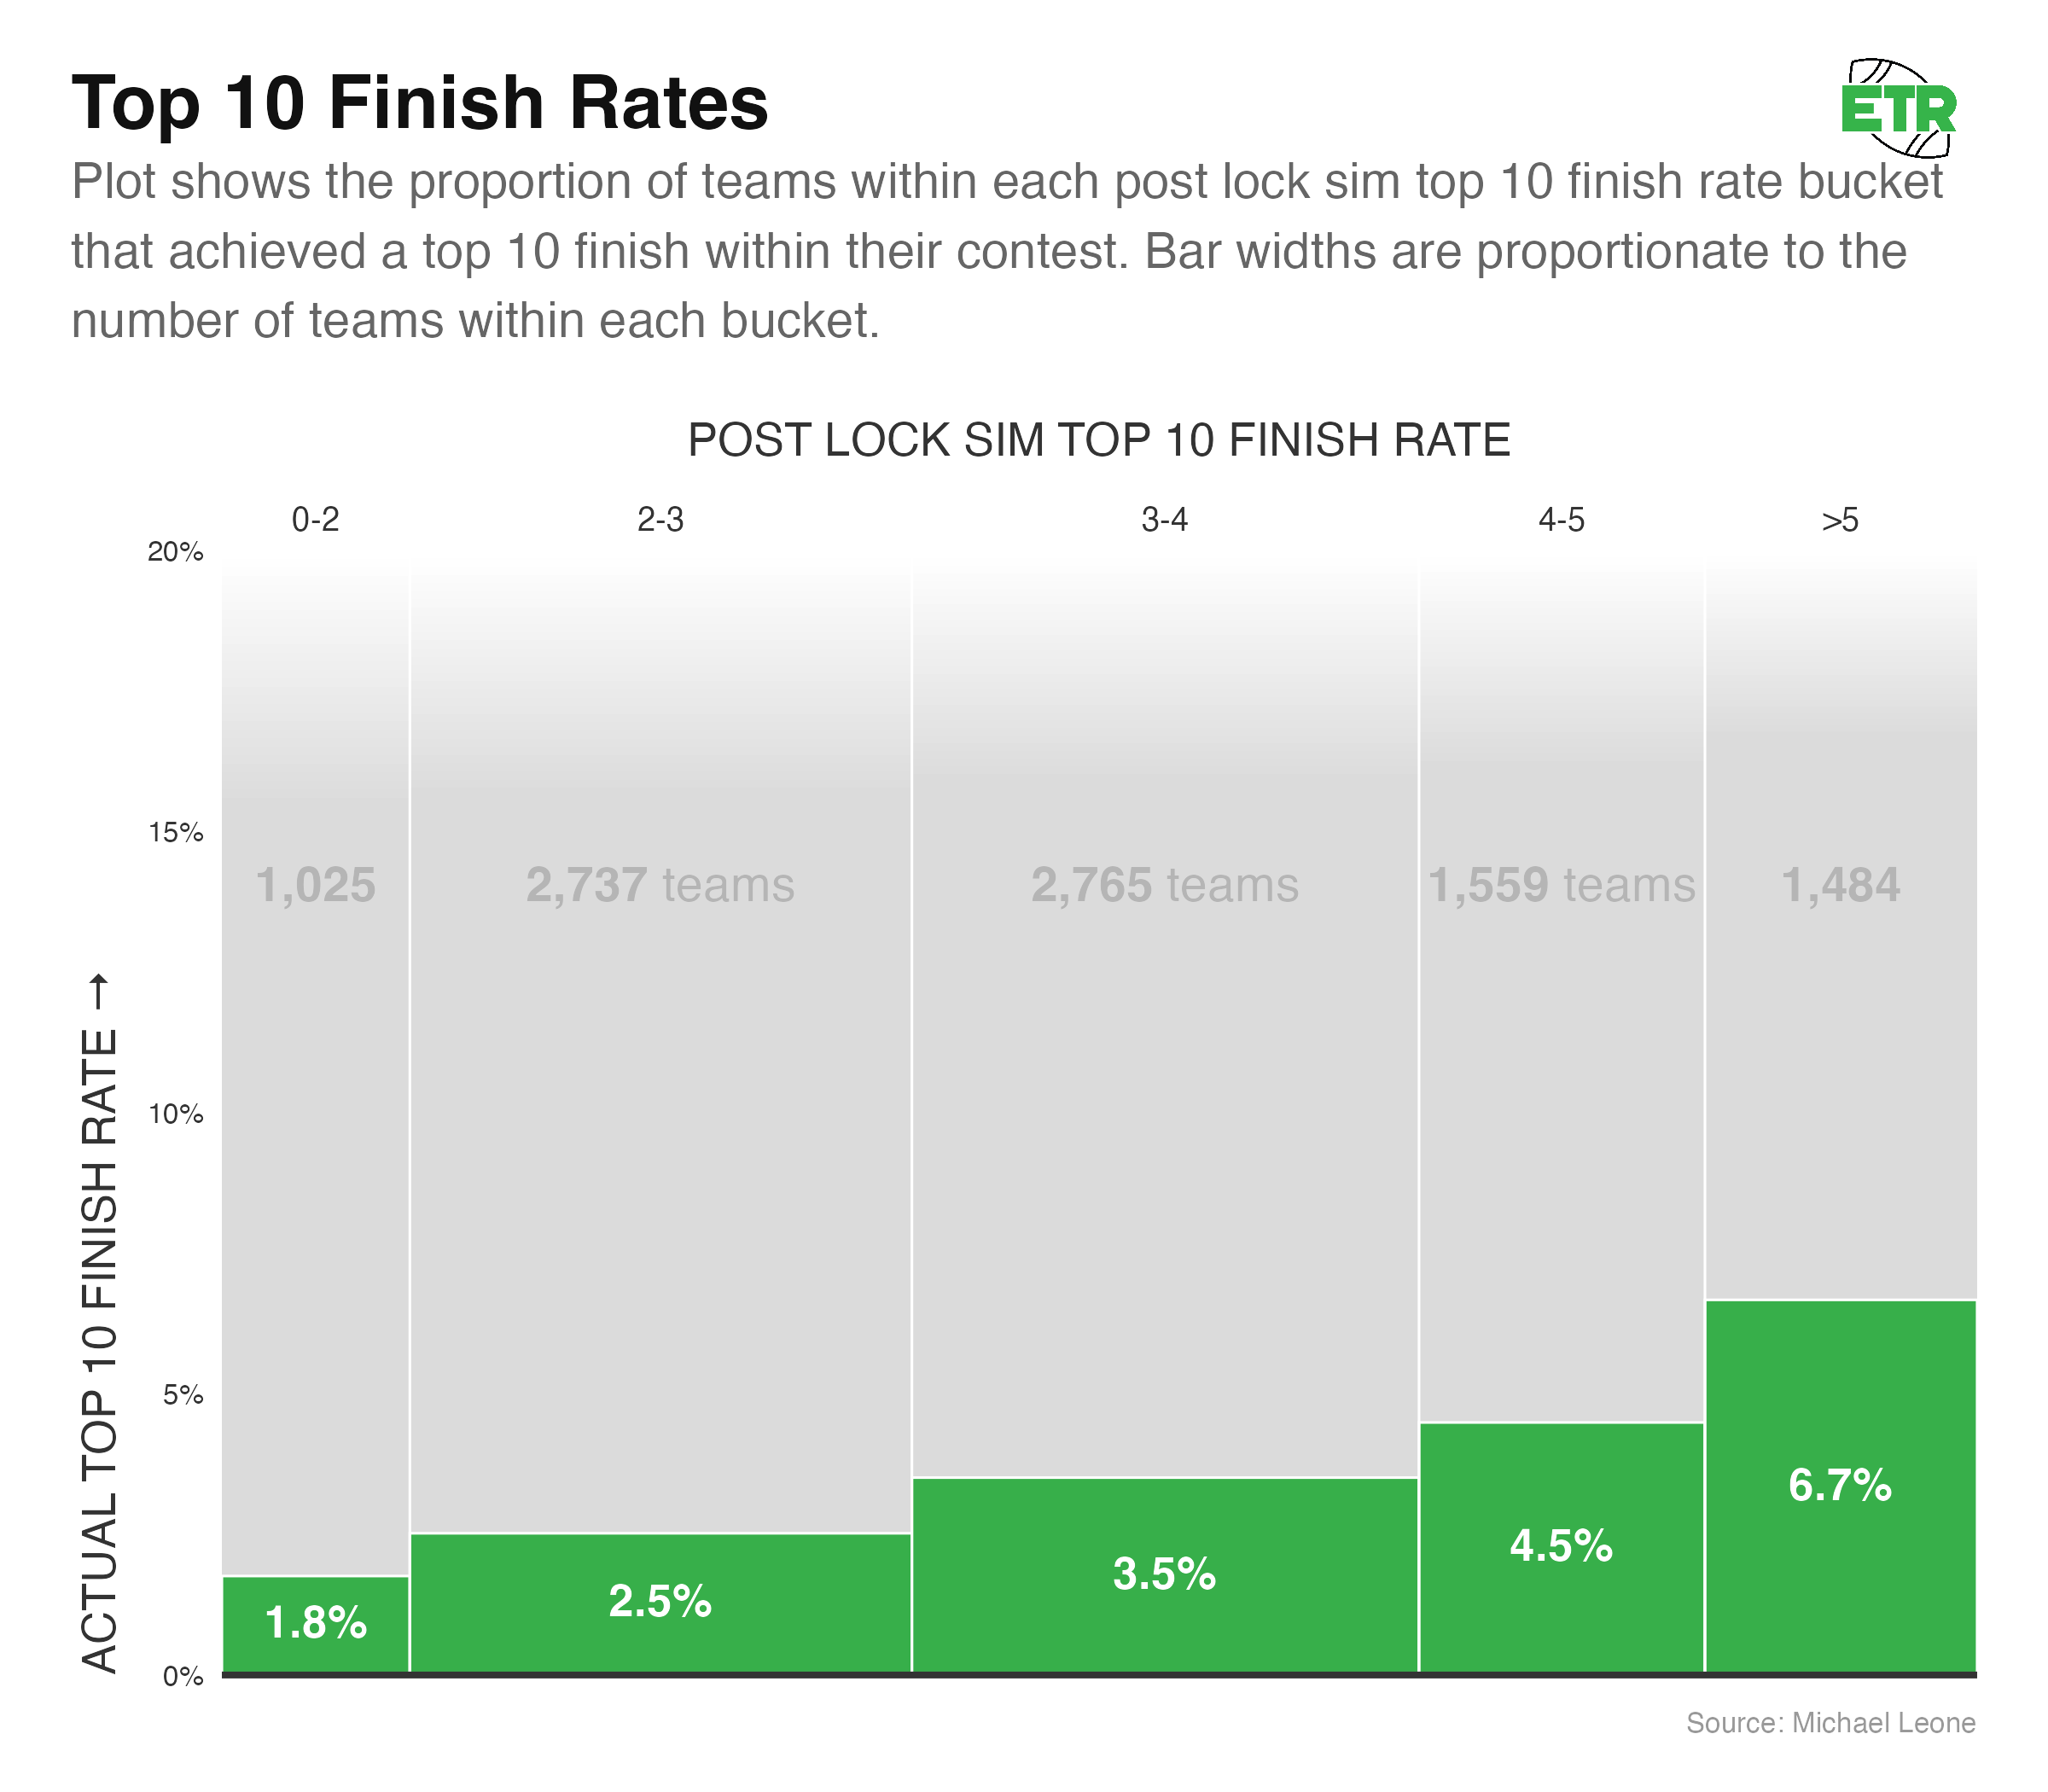
Once again, things look fairly well calibrated.
- The average actual top-10 rate of each bucket falls within the simulated bucket range for all five buckets.
- As the simulated top-10 rates increase for the buckets, the actual cash rates also increase.
Below is the breakdown of all buckets by a range of one percentage point:
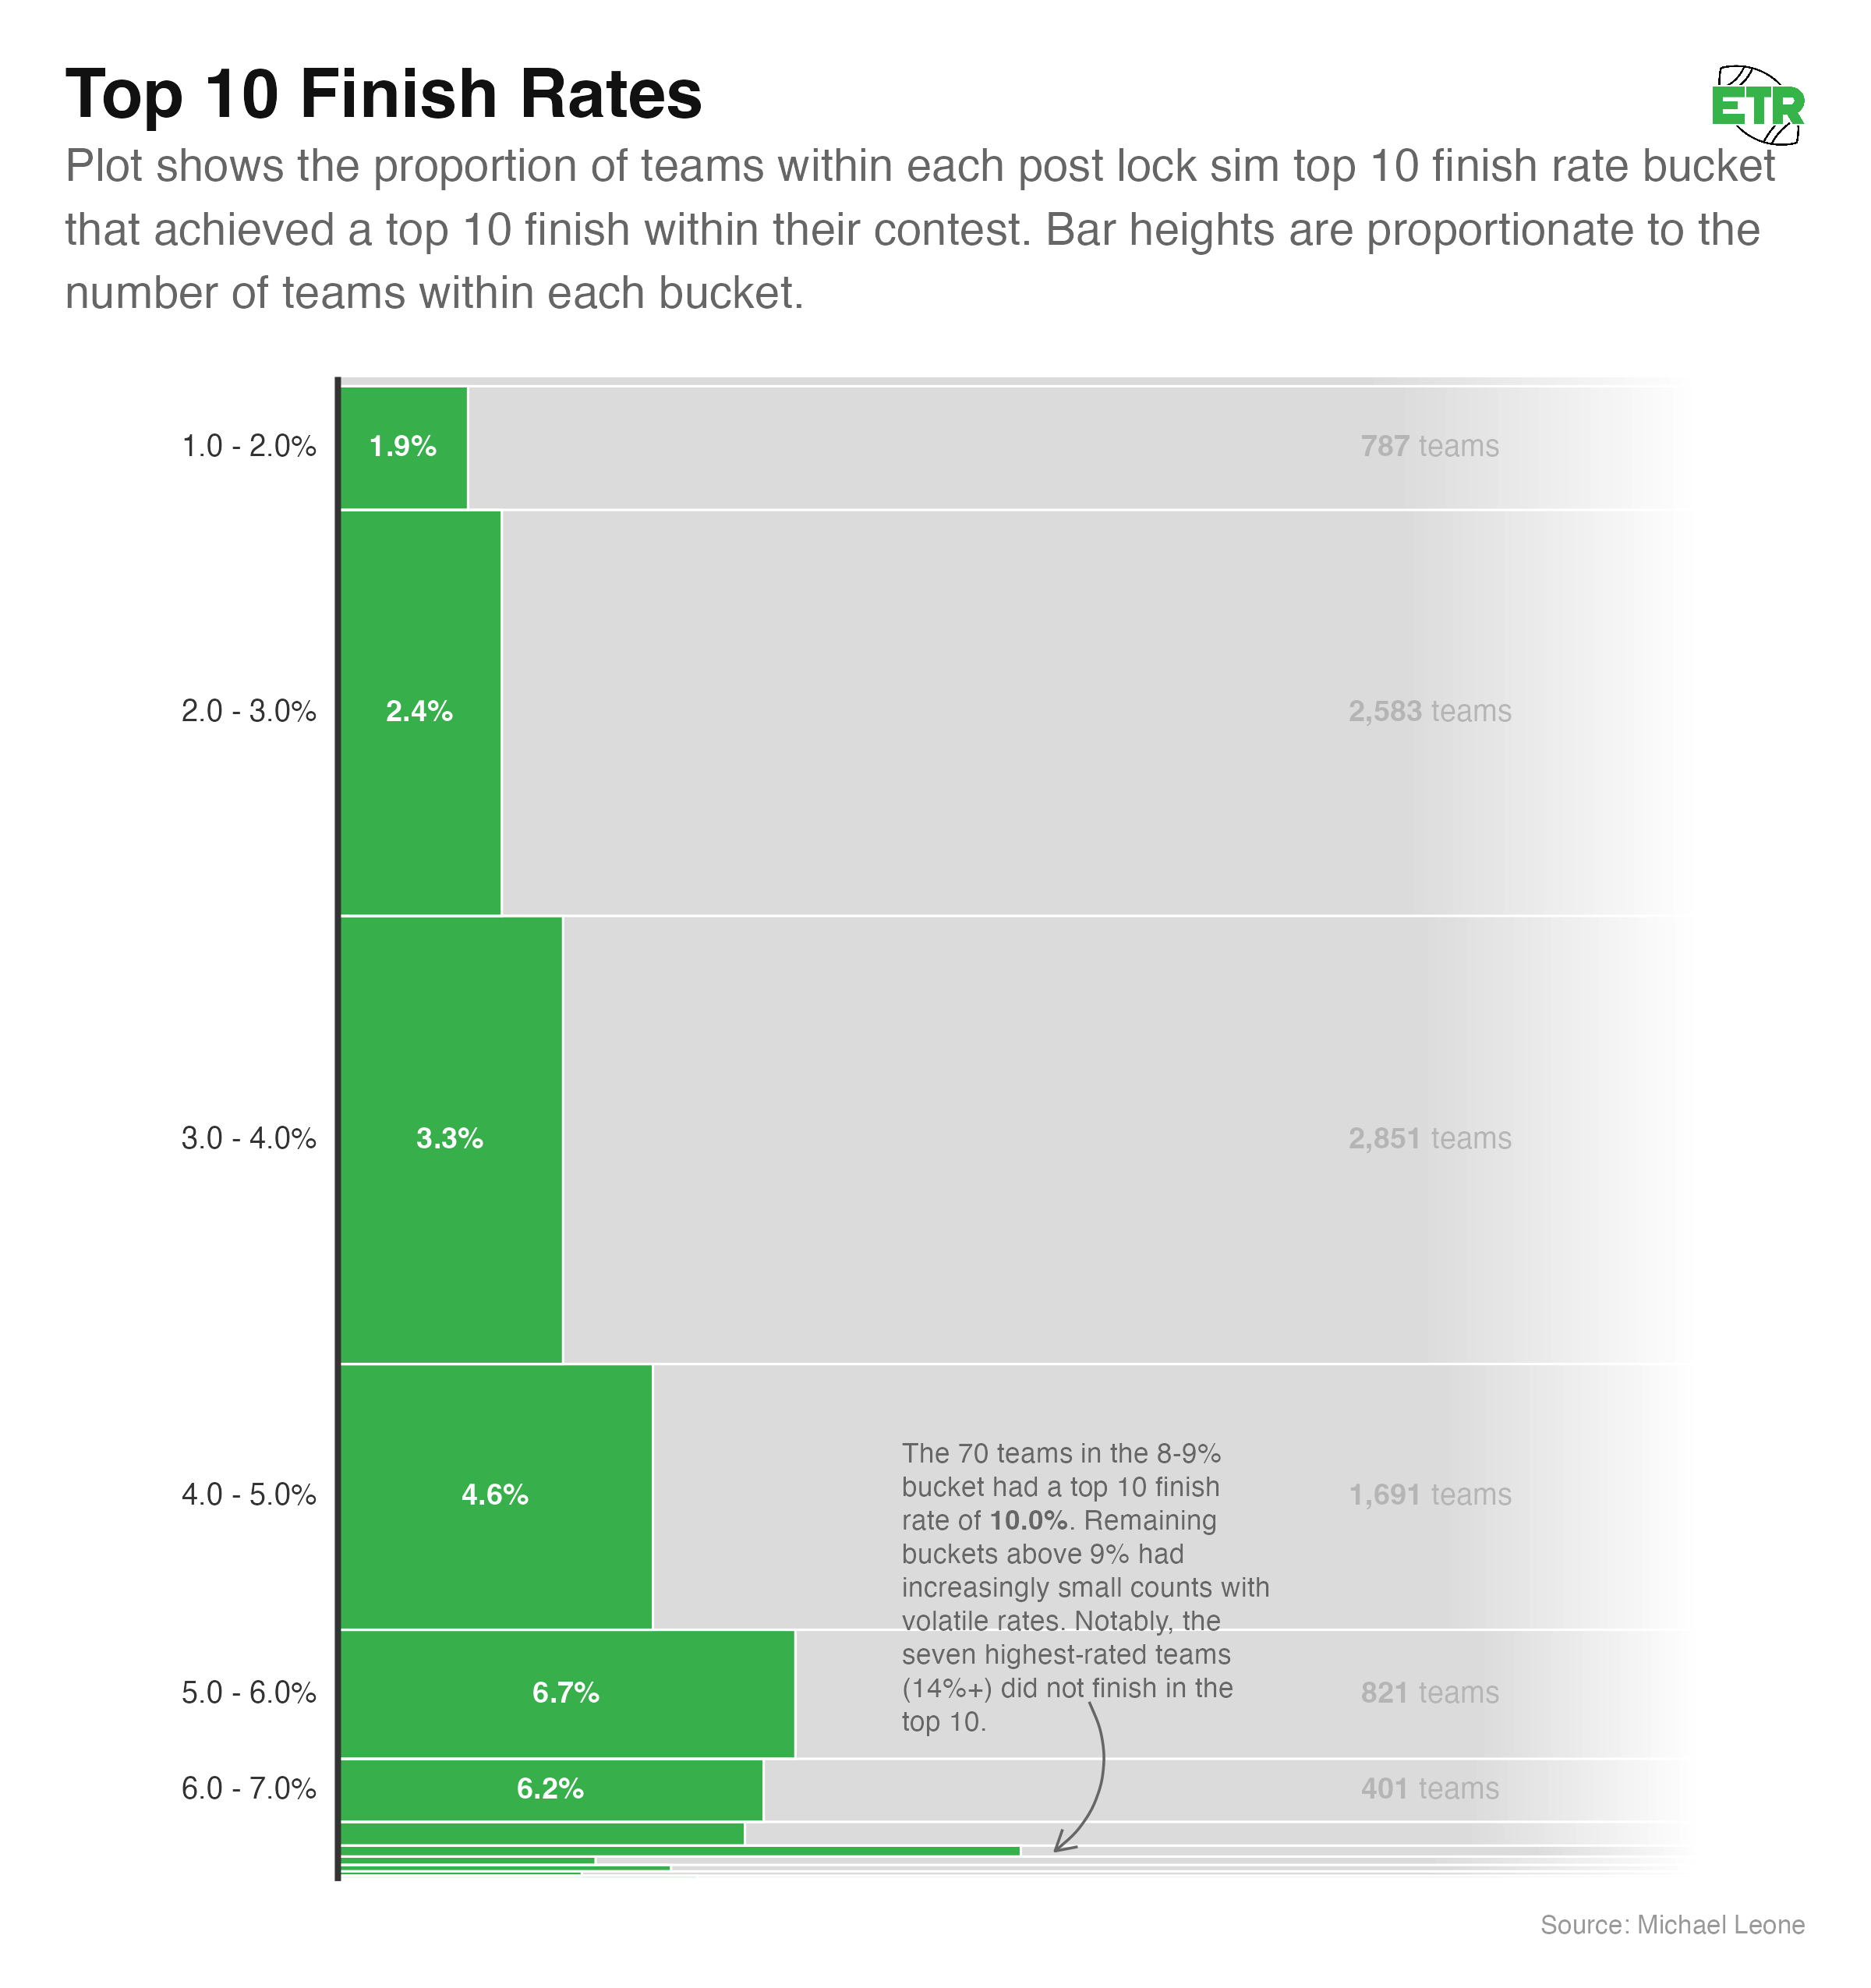
We once again see a very clear trend, but the overconfidence in the outlier high simulated top-10 rate buckets does not exist to the extend that it does for cash rate (if at all). If we grouped the 377 teams with a simulated top-10 rate of greater than 7% together, we’d have 24 actual top-10 finishes. That’s 6.4%, which is quite strong, though still less than the simulated expectation.
Sim ROI
The most impactful facet of a GPP player’s long-term profitability viability is their ability to outright win a contest. Unfortunately, this is the noisiest aspect to measure. It’s tough to get a large enough sample in a short enough time frame to make an accurate determination. That’s why evaluating cash rate and top-10 rates, as we did above, is important. The hope is that if those are well calibrated in the sim that win rate likely is as well.
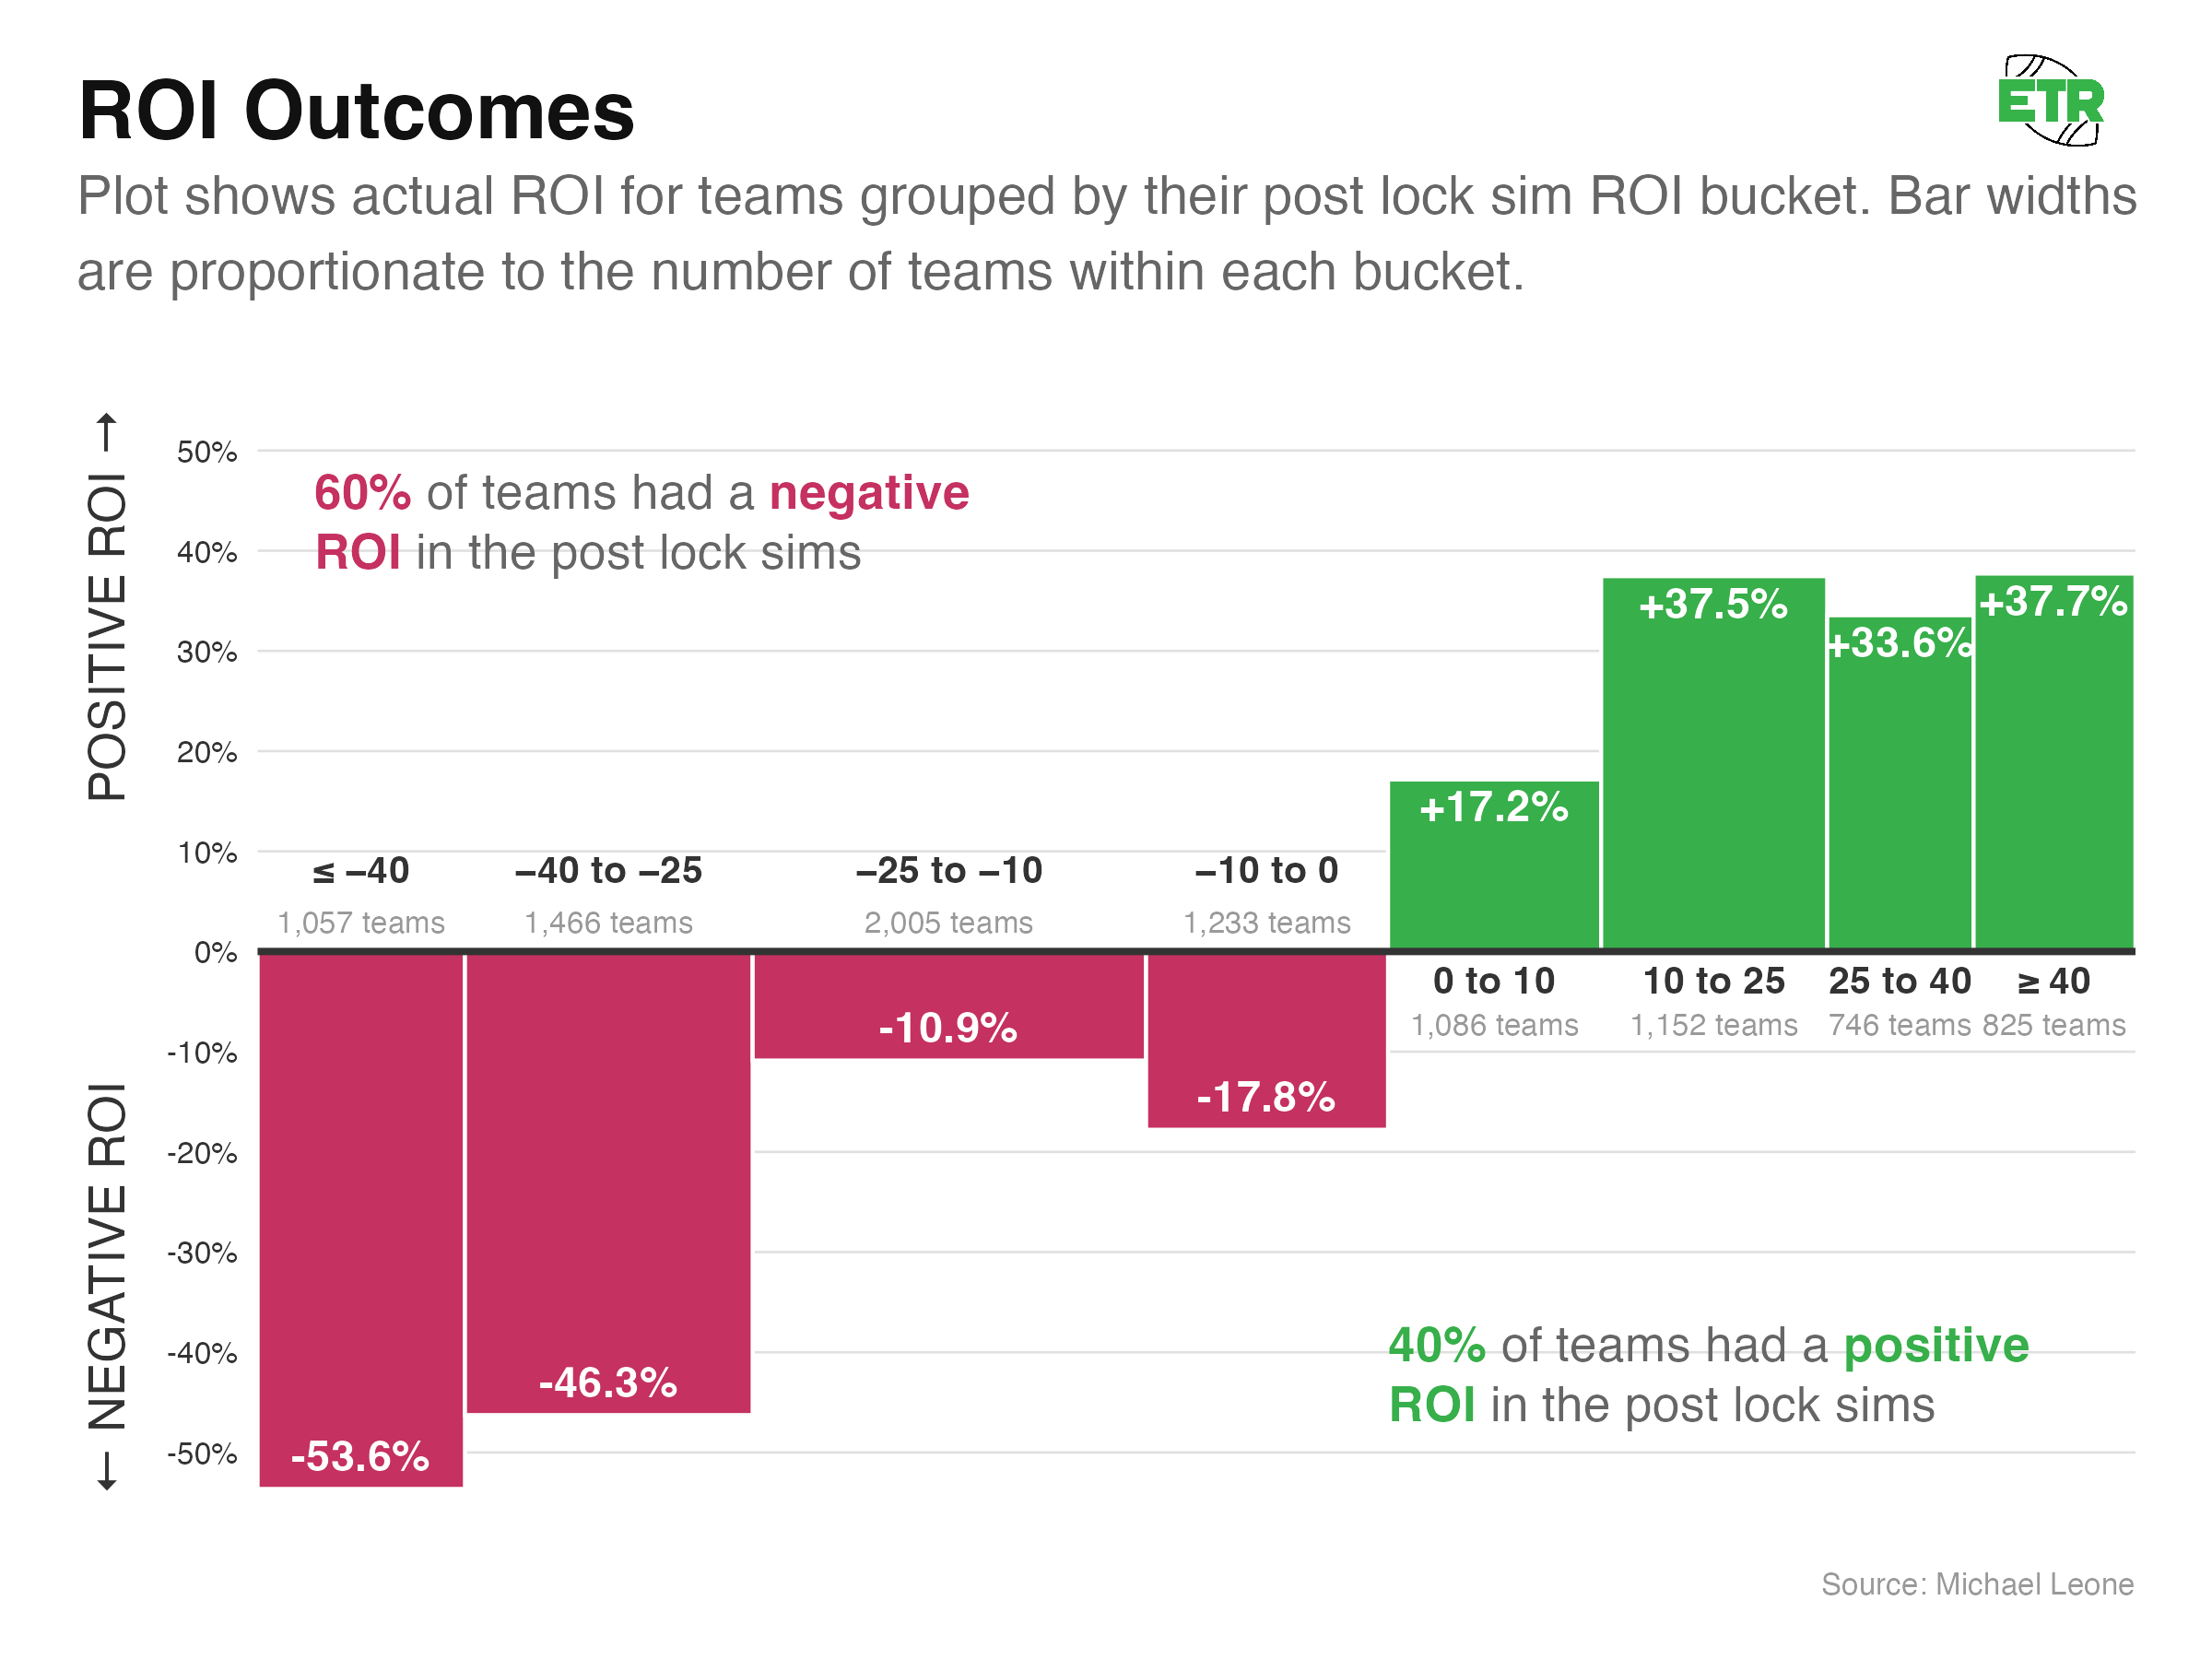
Despite the noise involved in who outright wins a contest and the impact that has on ROI, bucketing simulated ROI into eight logical groupings yields a lot of the same results we observed with both cash and top-10 rates:
There’s certainly more variance:
- The -25 to -10 bucket outperformed the -10 to 0 bucket, and the 10 to 25 bucket outperformed the 25 to 40 bucket.
- The actual mean ROIs of each bucket are ballpark close to the range of the simulated ROI bucket, but only three of the eight result in the actual mean ROI being contained within the associated bucket’s simulated ROI range.
But there’s also a clear signal in the simulated ROIs:
- All the -ROI buckets are actually -ROI, and all of the +ROI buckets are actually +ROI.
- As groups, the worst two buckets by sim ROI are the worst two buckets by actual ROI. The best three buckets by sim ROI are the best three buckets by actual ROI.
Conclusion
The results are honestly much better than I expected when I set out to write this article. It’s clear the results of the post-lock sims are meaningful, and that the better a lineup sims, the better chance it has to perform well in real life.
However, it’s not all sunshine and rainbows. It’s great that the sims are well calibrated in the aggregate, but we still need a reality check when translating that knowledge to what it means for us as individual DFS players.
We don’t get to play the entire collection of 10+% simulated ROI teams in the Game Changer each week. We’re limited to one entry per week. It’s more nuanced and challenging to win at DFS than simply pumping out well-simulating teams and collecting our money.
There’s still skill in picking which specific lineup to play on a given week, and even if we’re able to do so, it’s important to understand how much at the mercy of variance we still are.
In Part 2 of this article, I’ll take you through a bankroll simulator model I’ve developed specifically for the Game Changer to highlight what your realistic expectations should be.
In Part 3, I’ll lay out some heuristics I’ve established as a result of this analysis in an effort to play lineups that are likely to consistently sim well post-lock and perform well in reality.
Part 2: What Does This Mean For Your Bankroll?
As we finished Part 1, I was tempering the enthusiasm from knowing the sims are well calibrated. I know from firsthand experience that generating a strong post-lock ROI consistently is not an automatic ticket to DFS profit, especially over a small sample.
I did not play the Game Changer for all 35 weeks, but I did play it 22 times. Here are my results:
Yikes! It’s been ugly for me in this contest. On a total buy-in of $33,000, I’ve won $14,000 in prizes, giving me a realized ROI of -57.6%.
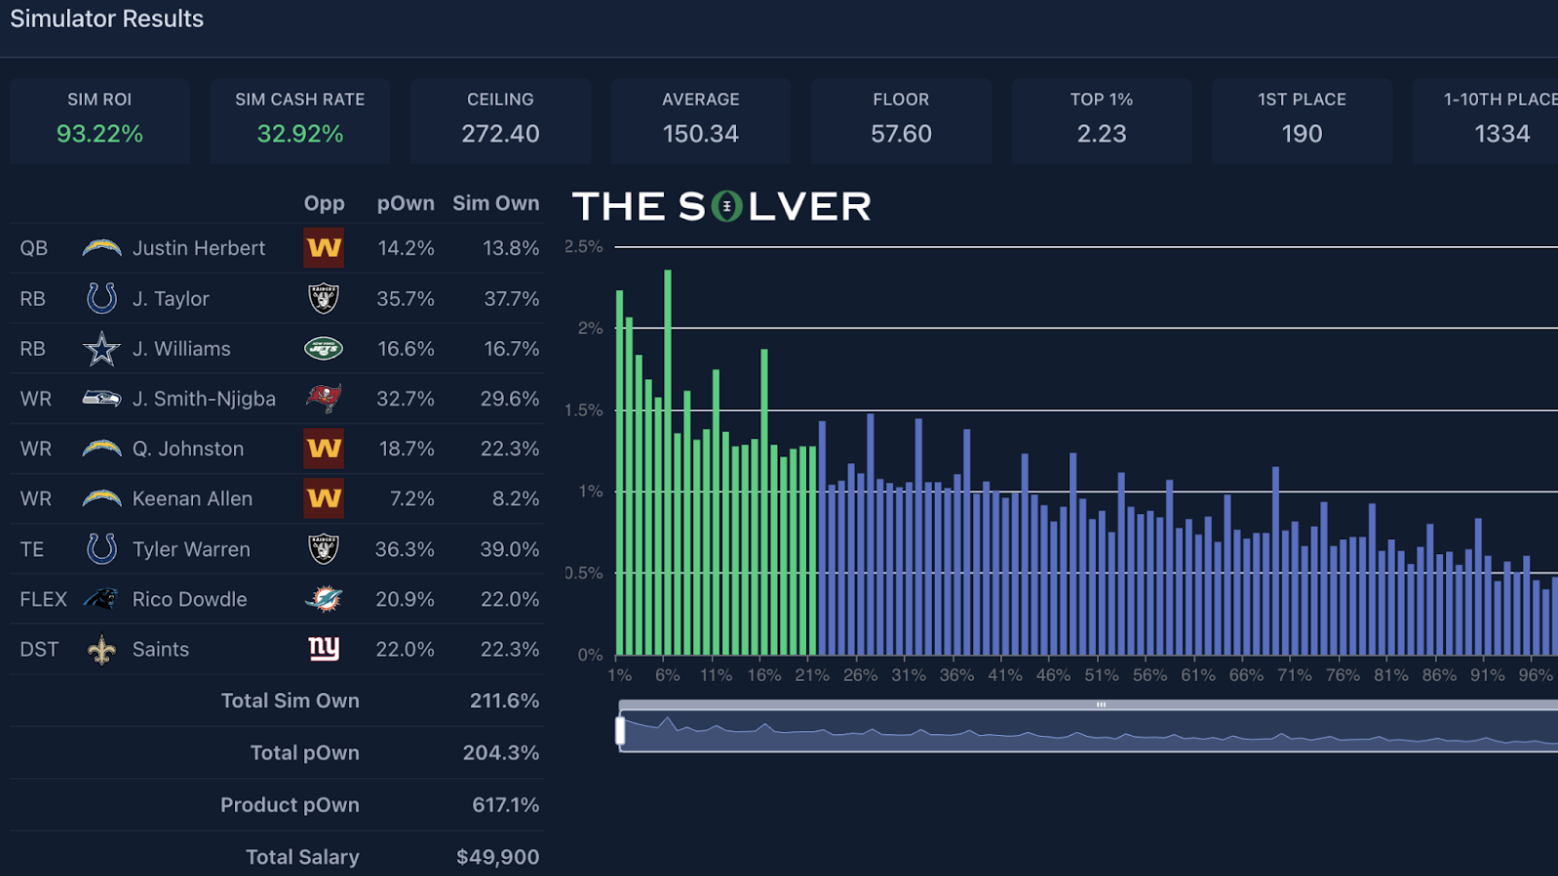
To wrap my head around this, I wanted to develop a bankroll simulator. But I didn’t want to assume that the post-lock lineup characteristics (ROI, Cash Rate, Top-10 Rate, Top-1% Rate) were the gospel truth. We know from Part 1 that while the sims are well calibrated, they’re not perfect.
So, I created a model to take in those four post-lock sim characteristics as predictor variables, with the target variable being the probability of winning any particular Game Changer prize on a given week. Below are examples of five different post-lock lineups I fed into the model and what the predicted actual ROI and cash rates are:
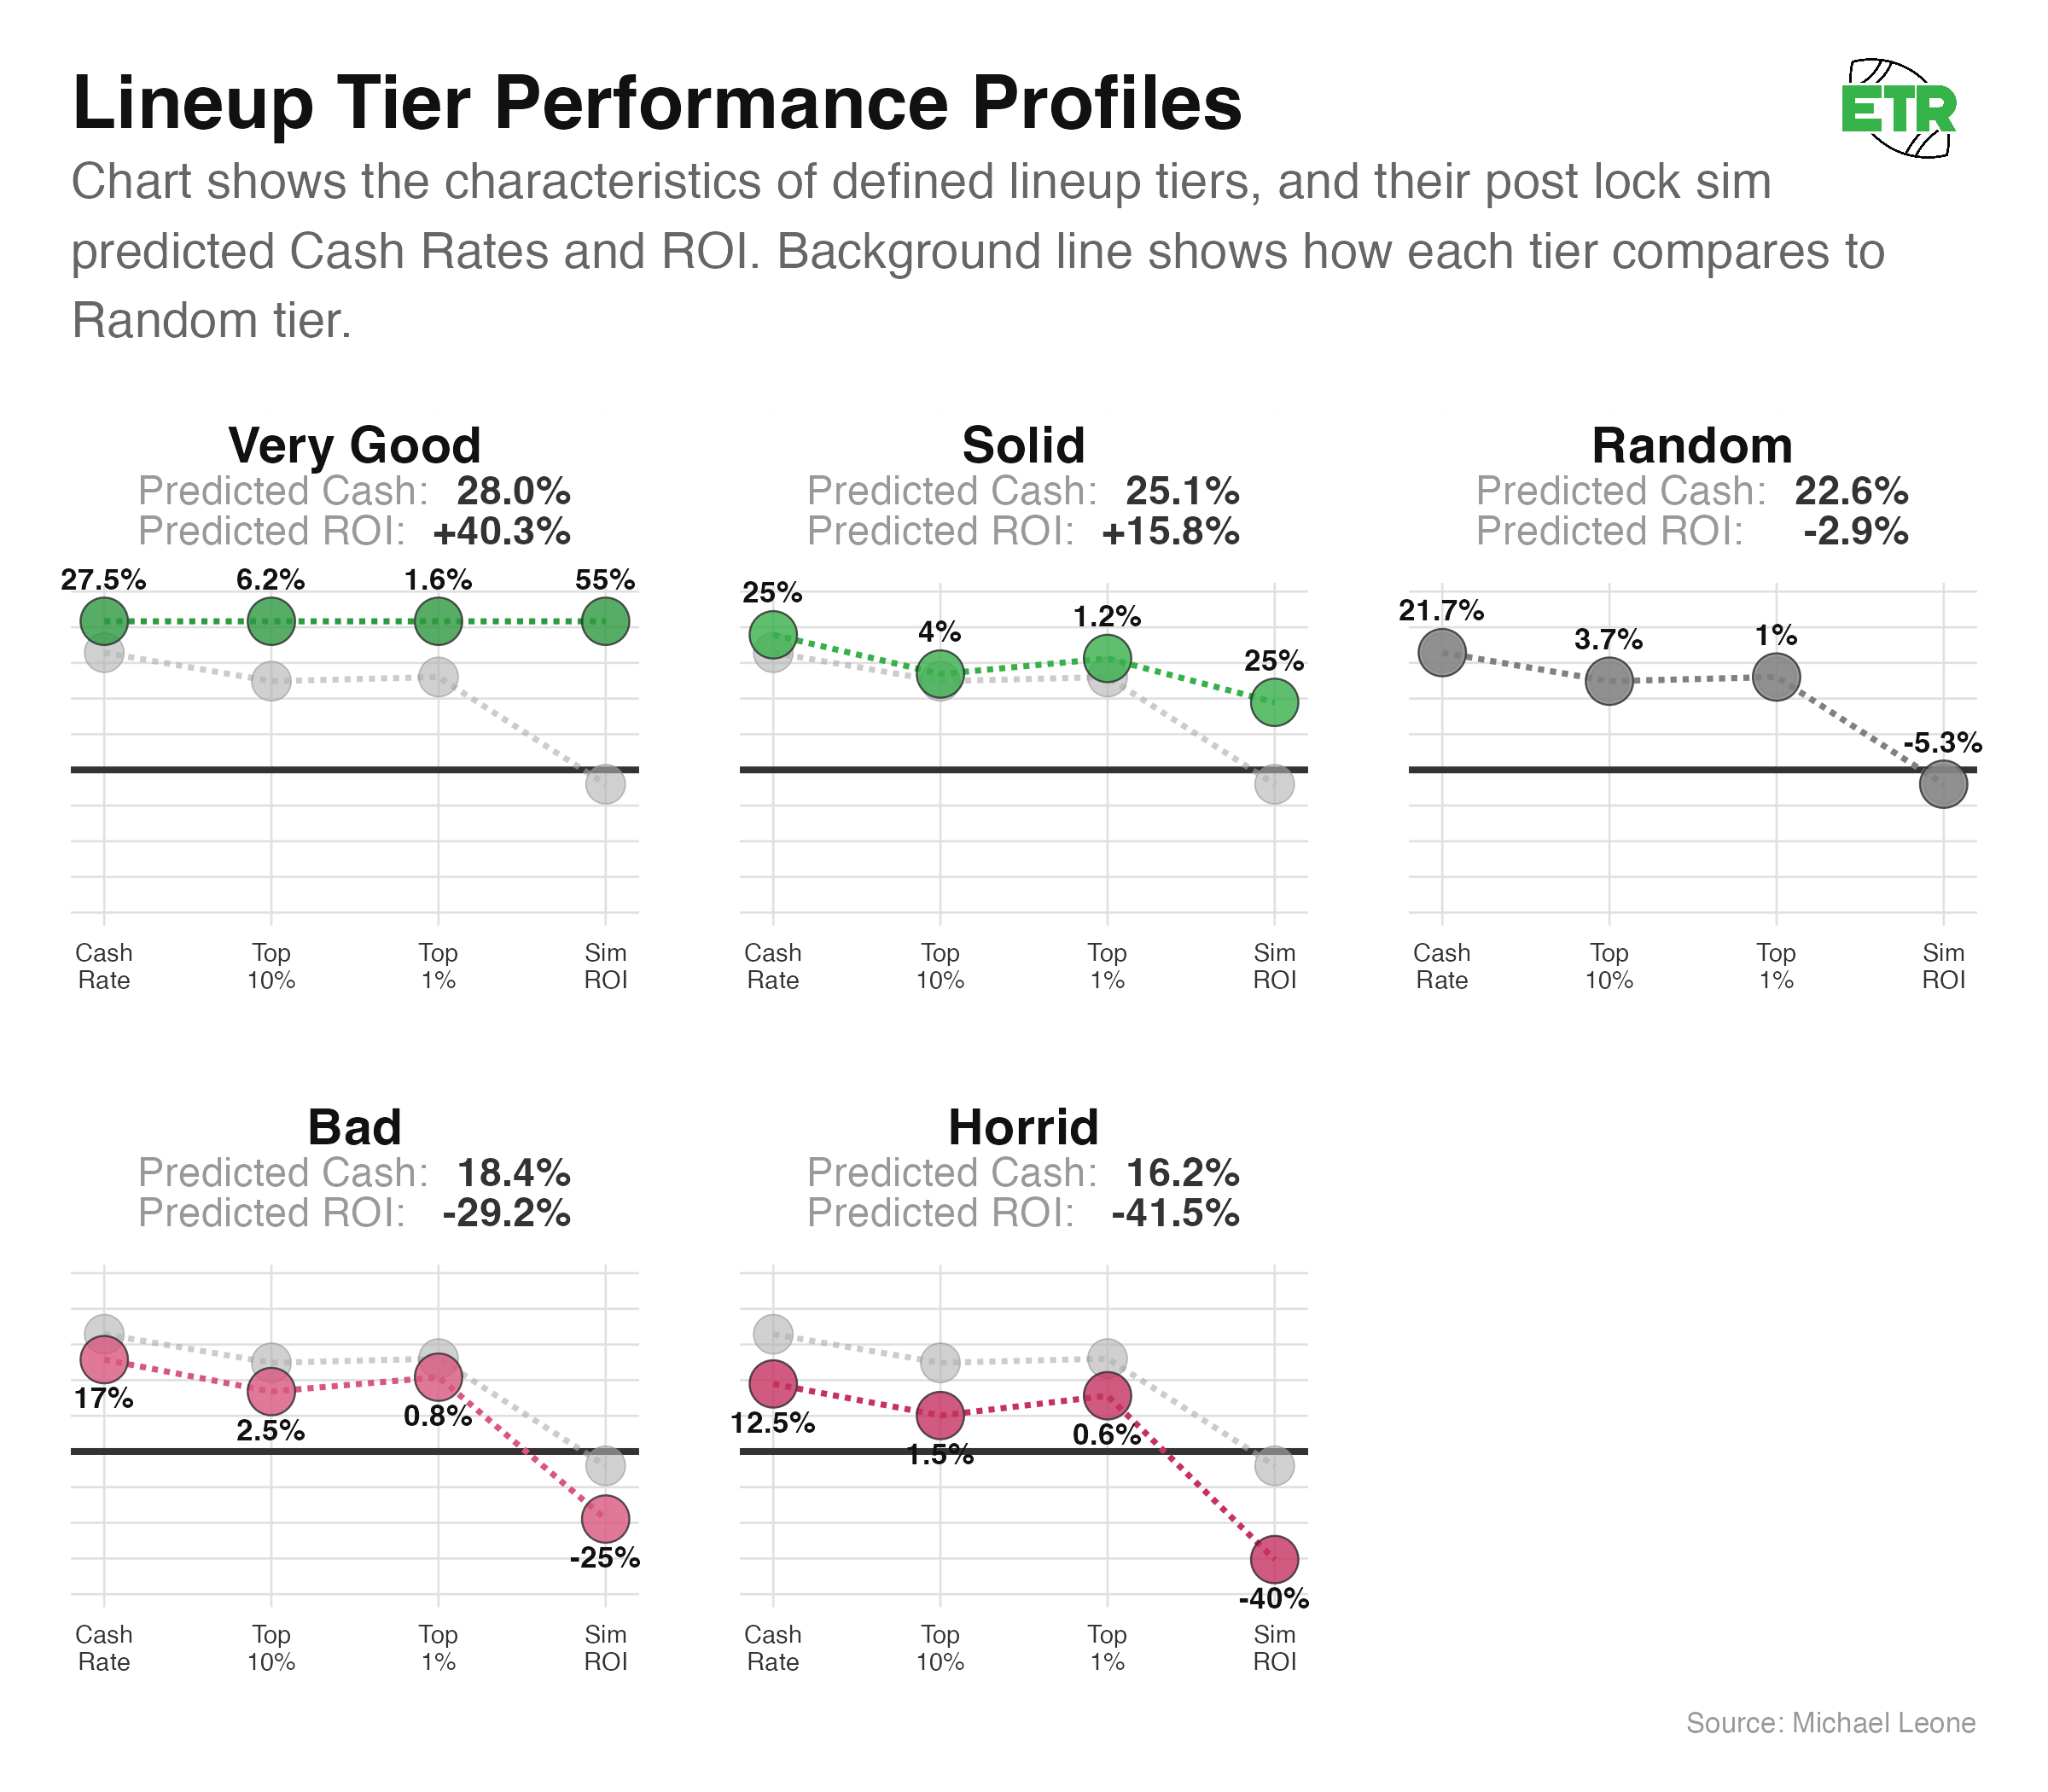
This model is overfit, as it’s trained on all of the 35 weeks of Game Changer results that we have, but still useful (I was more interested in an accurate bankroll simulator than thoroughly making the best ROI or cash-rate predictions).
It’s interesting to observe some things the model picks up on:
- The best simulating lineups have the most heavily regressed predictions (but still predict to perform well).
- A neutral lineup (“Random Expectation”) is predicted to perform a little bit better than the sims indicate.
- The bad/horrid lineups are predicted to perform about as poorly as their simulated characteristics.
- Sim top-10 rates have a greater influence on predicted lineup behavior than sim cash rates (see the chart below).
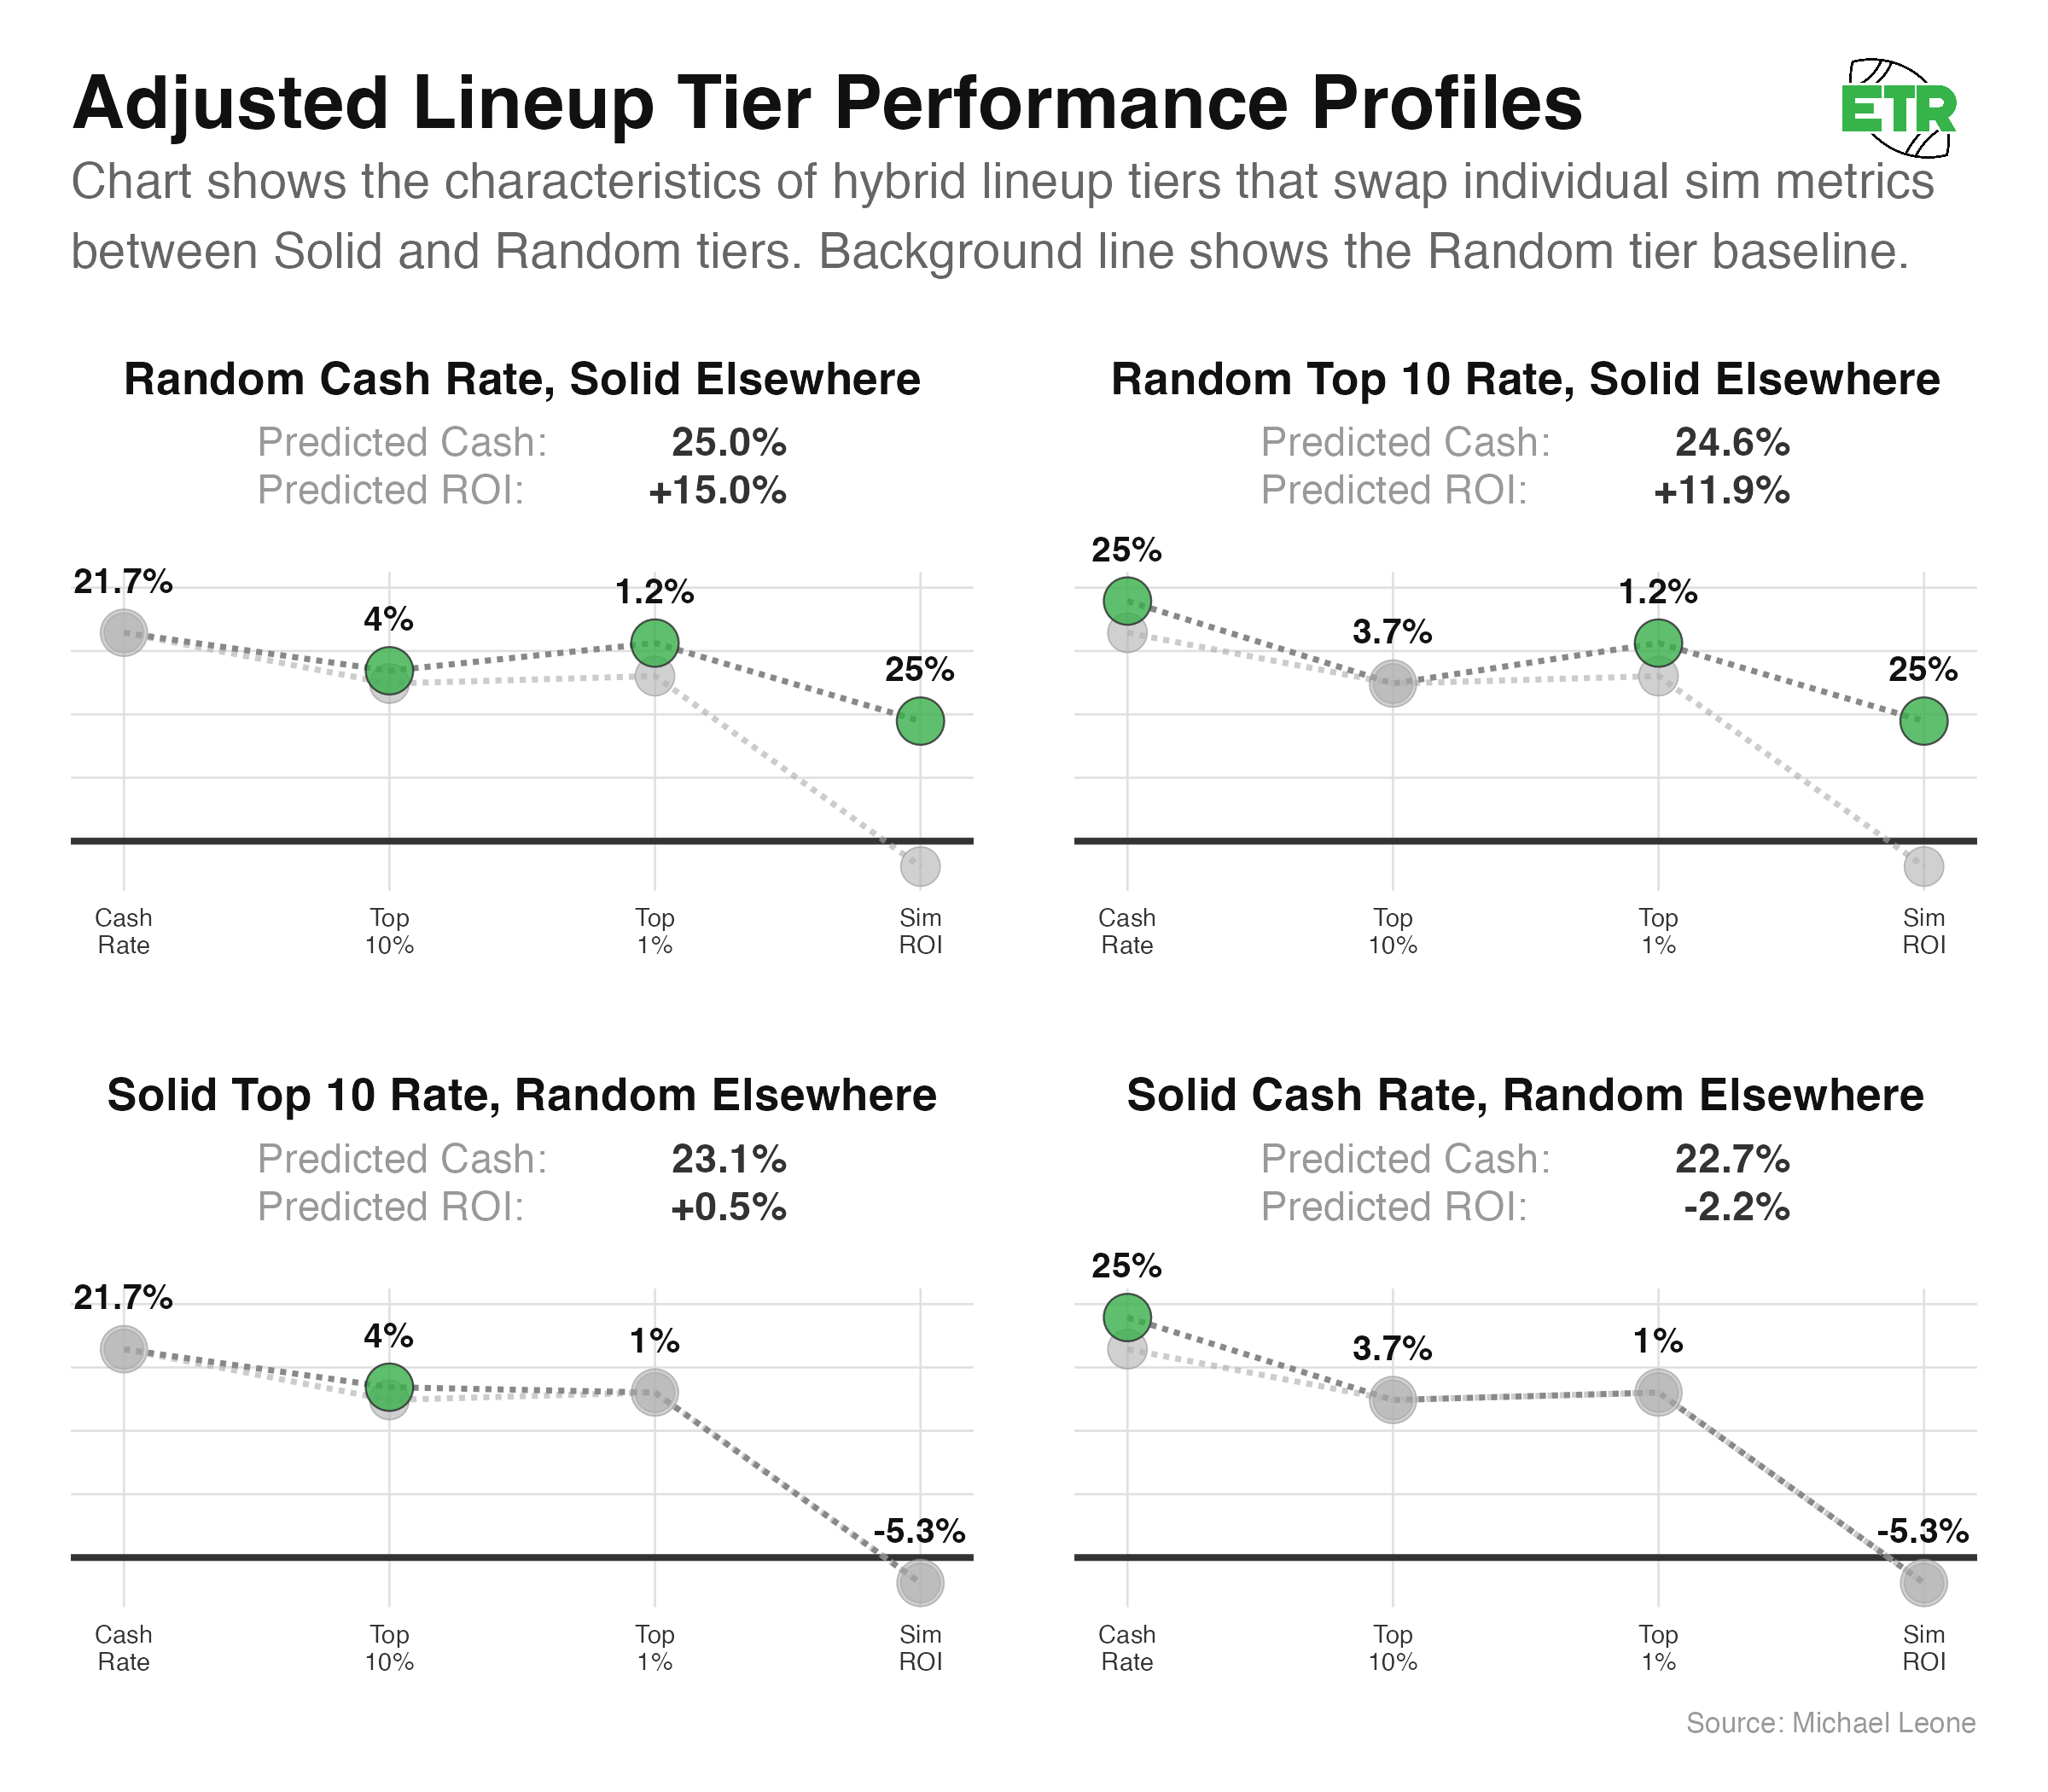
The above chart is a little confusing. It basically shows us that if we compare four sets of predictor variables, only adjusting either sim cash rate or sim top-10 rate, positive adjustments to sim top-10 rate have a larger impact on the model’s predicted ROI than similarly scaled positive adjustments to sim cash rate.
For clarity, the model has to give me results. So, if I feed it incongruous lineup characteristics, such as a 50% sim cash rate and a -50% sim ROI, the model will still “work.” Also, the lineup does not directly predict an actual ROI or actual cash rate. It randomly assigns a Game Changer prize for a single week, and if we simulate enough weeks, we’re able to deduce the mean ROI and mean cash rate (the predicted cash and predicted ROI numbers you see in the preceding two charts).
Bankroll Implications
We can now simulate full seasons of DFS play in the Game Changer, with the assumption that you play in the contest 18 times a year (every week of the regular season) and you know what your lineup’s post-lock sim characteristics will be.
Doing so allows us to glean the following information:
- Odds of Profit
- Odds of Losing Money
- Odds my actual results occurred
- Odds of Losing X seasons in a row
- Odds of Binking
- Odds of Profiting if not Binking
- Odds of Ruin
Odds of Profit
Here are the odds of profiting X seasons in a row or of being profitable at all after X seasons, assuming you keep playing each week no matter what.
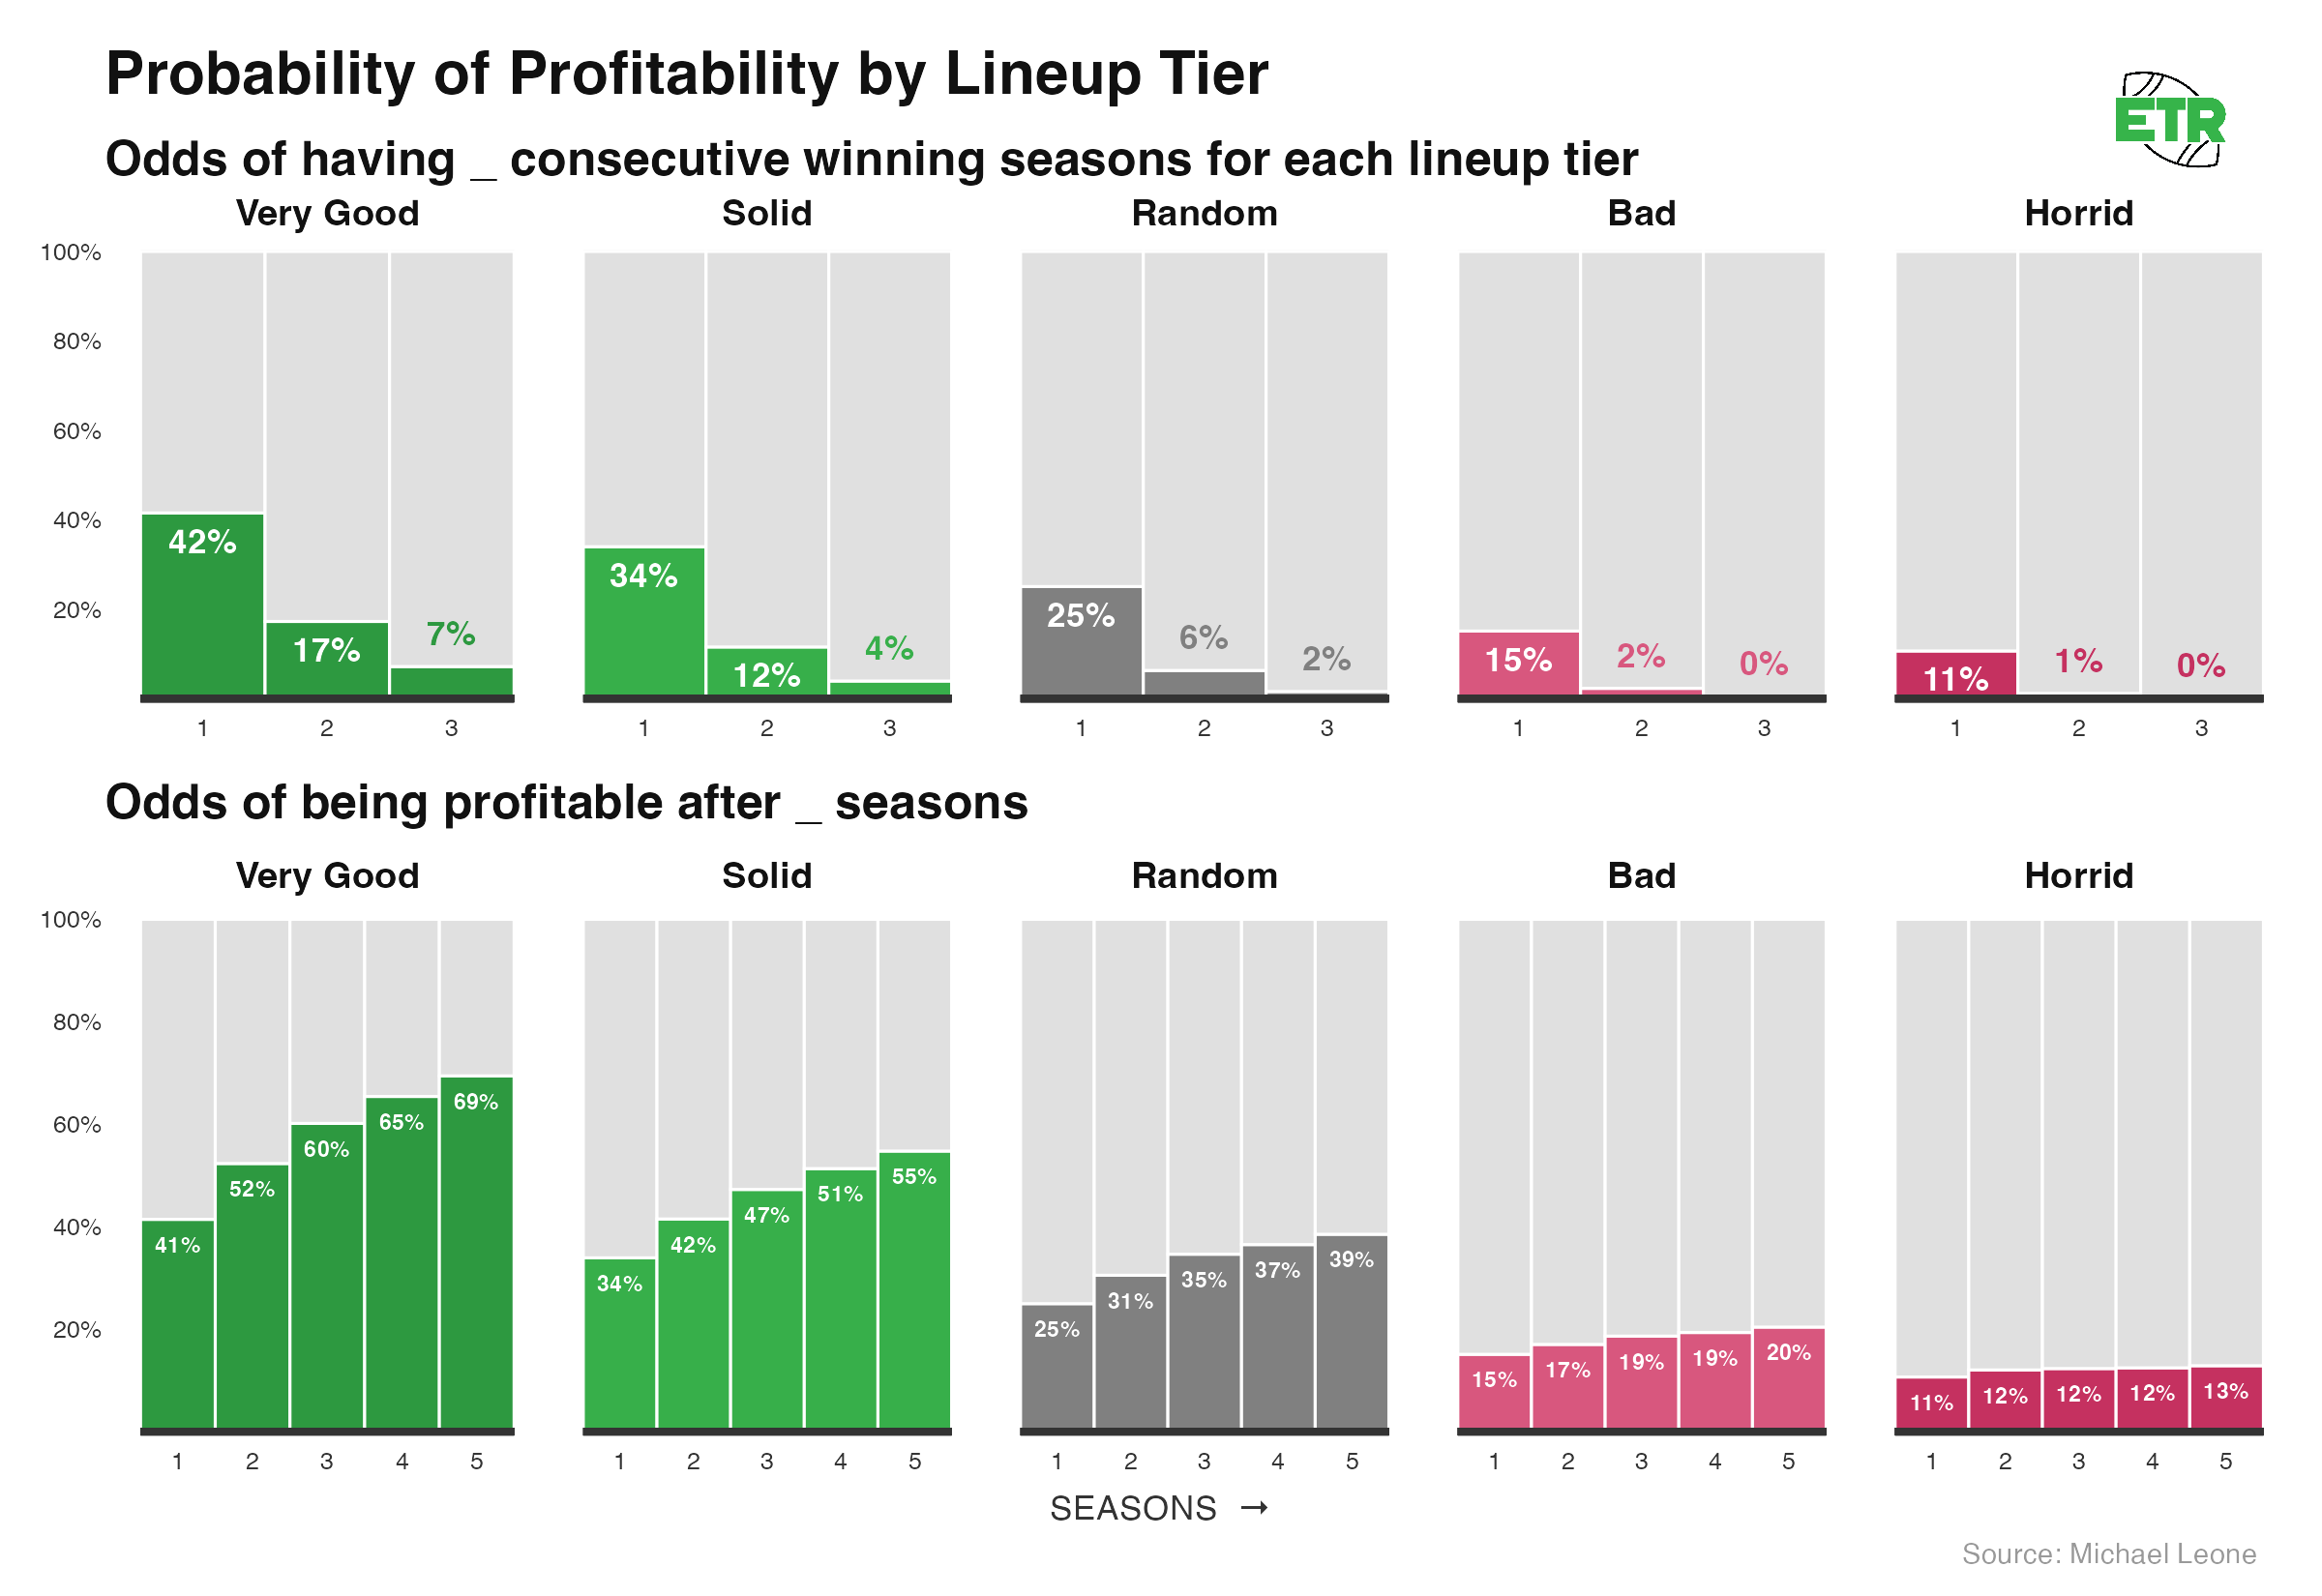
Notes:
- Even the best lineups are less than 50% to have a profitable season.
- It’s really difficult to consistently win; the random expectation lineup has just a 1.6% chance of stringing together three consecutive profitable years.
- However, since profit is highly correlated with binking, and the bink odds increase over time, good lineups are greater than 50/50 to be profitable on the whole after five seasons.
- It’s still striking that the best lineups are ~30% to lose money even after five seasons.
Odds of Losing Money
We’re once again assuming you keep playing each week, no matter what.
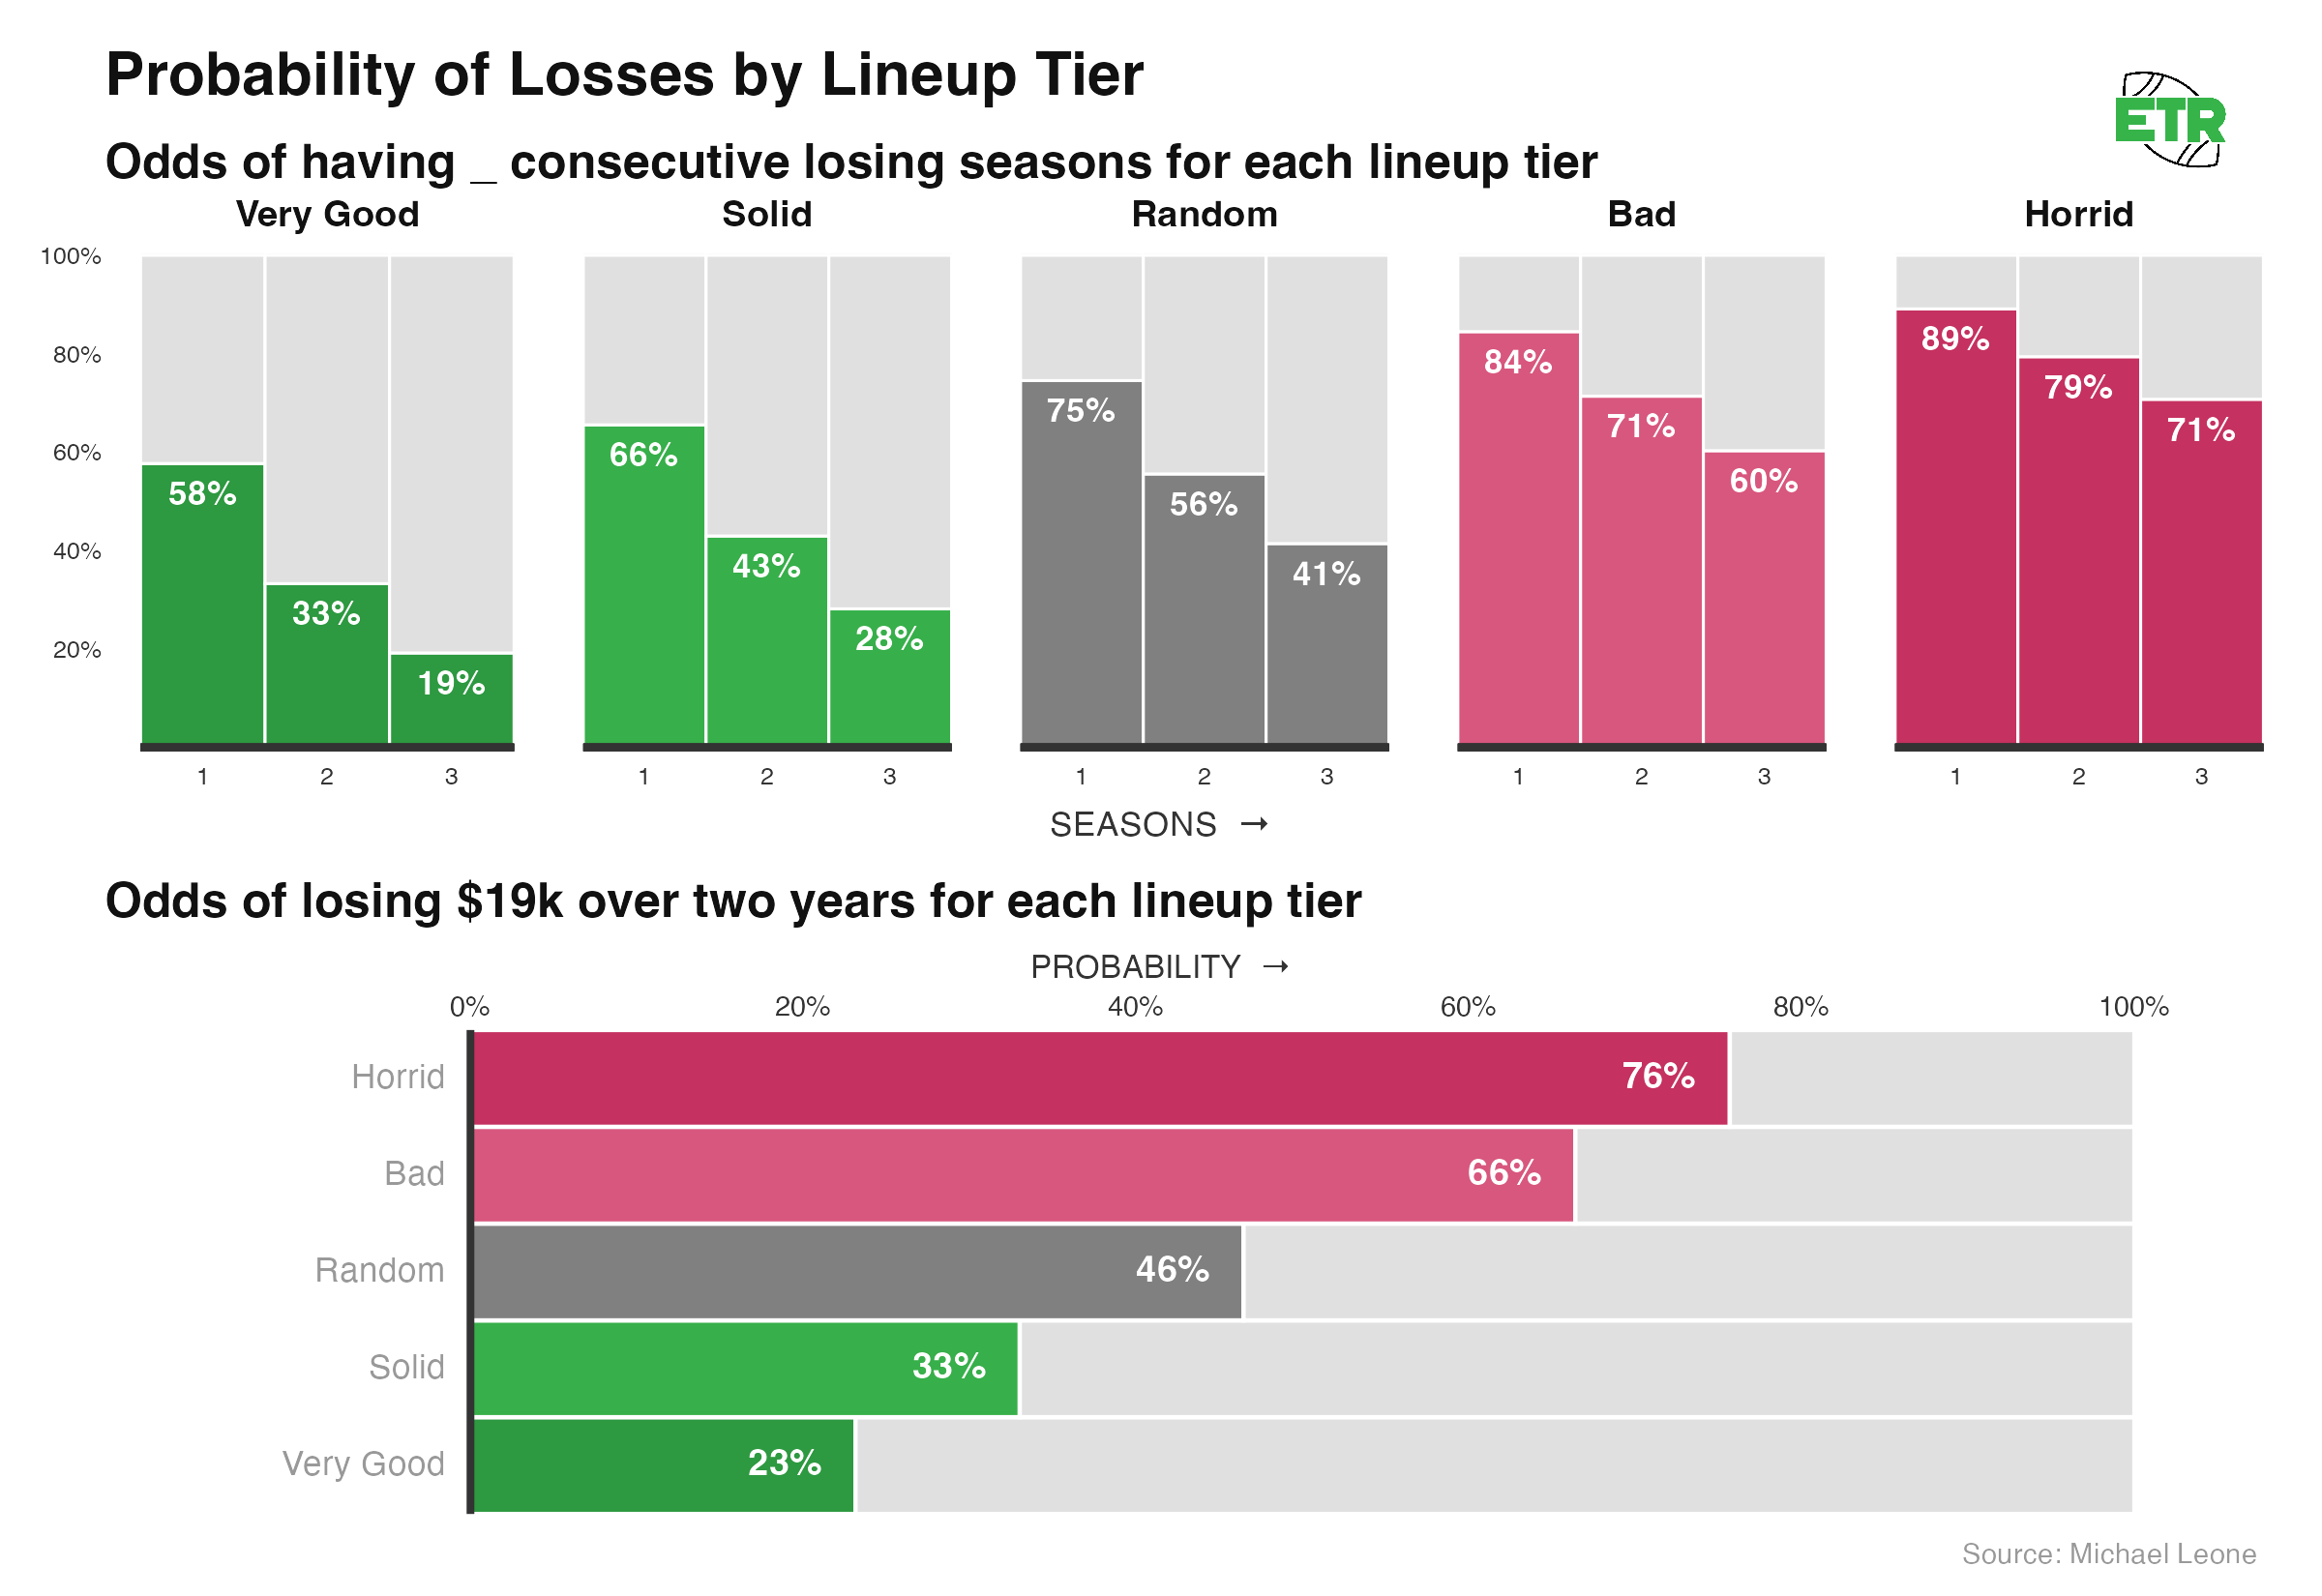
Notes:
- While we’ve seen that bad lineups can and do win the Game Changer often enough, a single bad lineup is a terrible bet over time. A negatively-simulating lineup has greater odds of losing three consecutive seasons than it does of posting even one profitable year over three seasons.
- If playing a neutral lineup, you’re nearly a coin flip to have the two-year run I had in the GC, and at a 23% chance even when playing the best lineups.
Odds of Binking
If we define binking as winning at least $50K on a given week (generally first is $100K in the GC and second is $50K, but some weeks first is $50K), below are the odds a lineup A) binks and B) doesn’t bink but is still profitable.
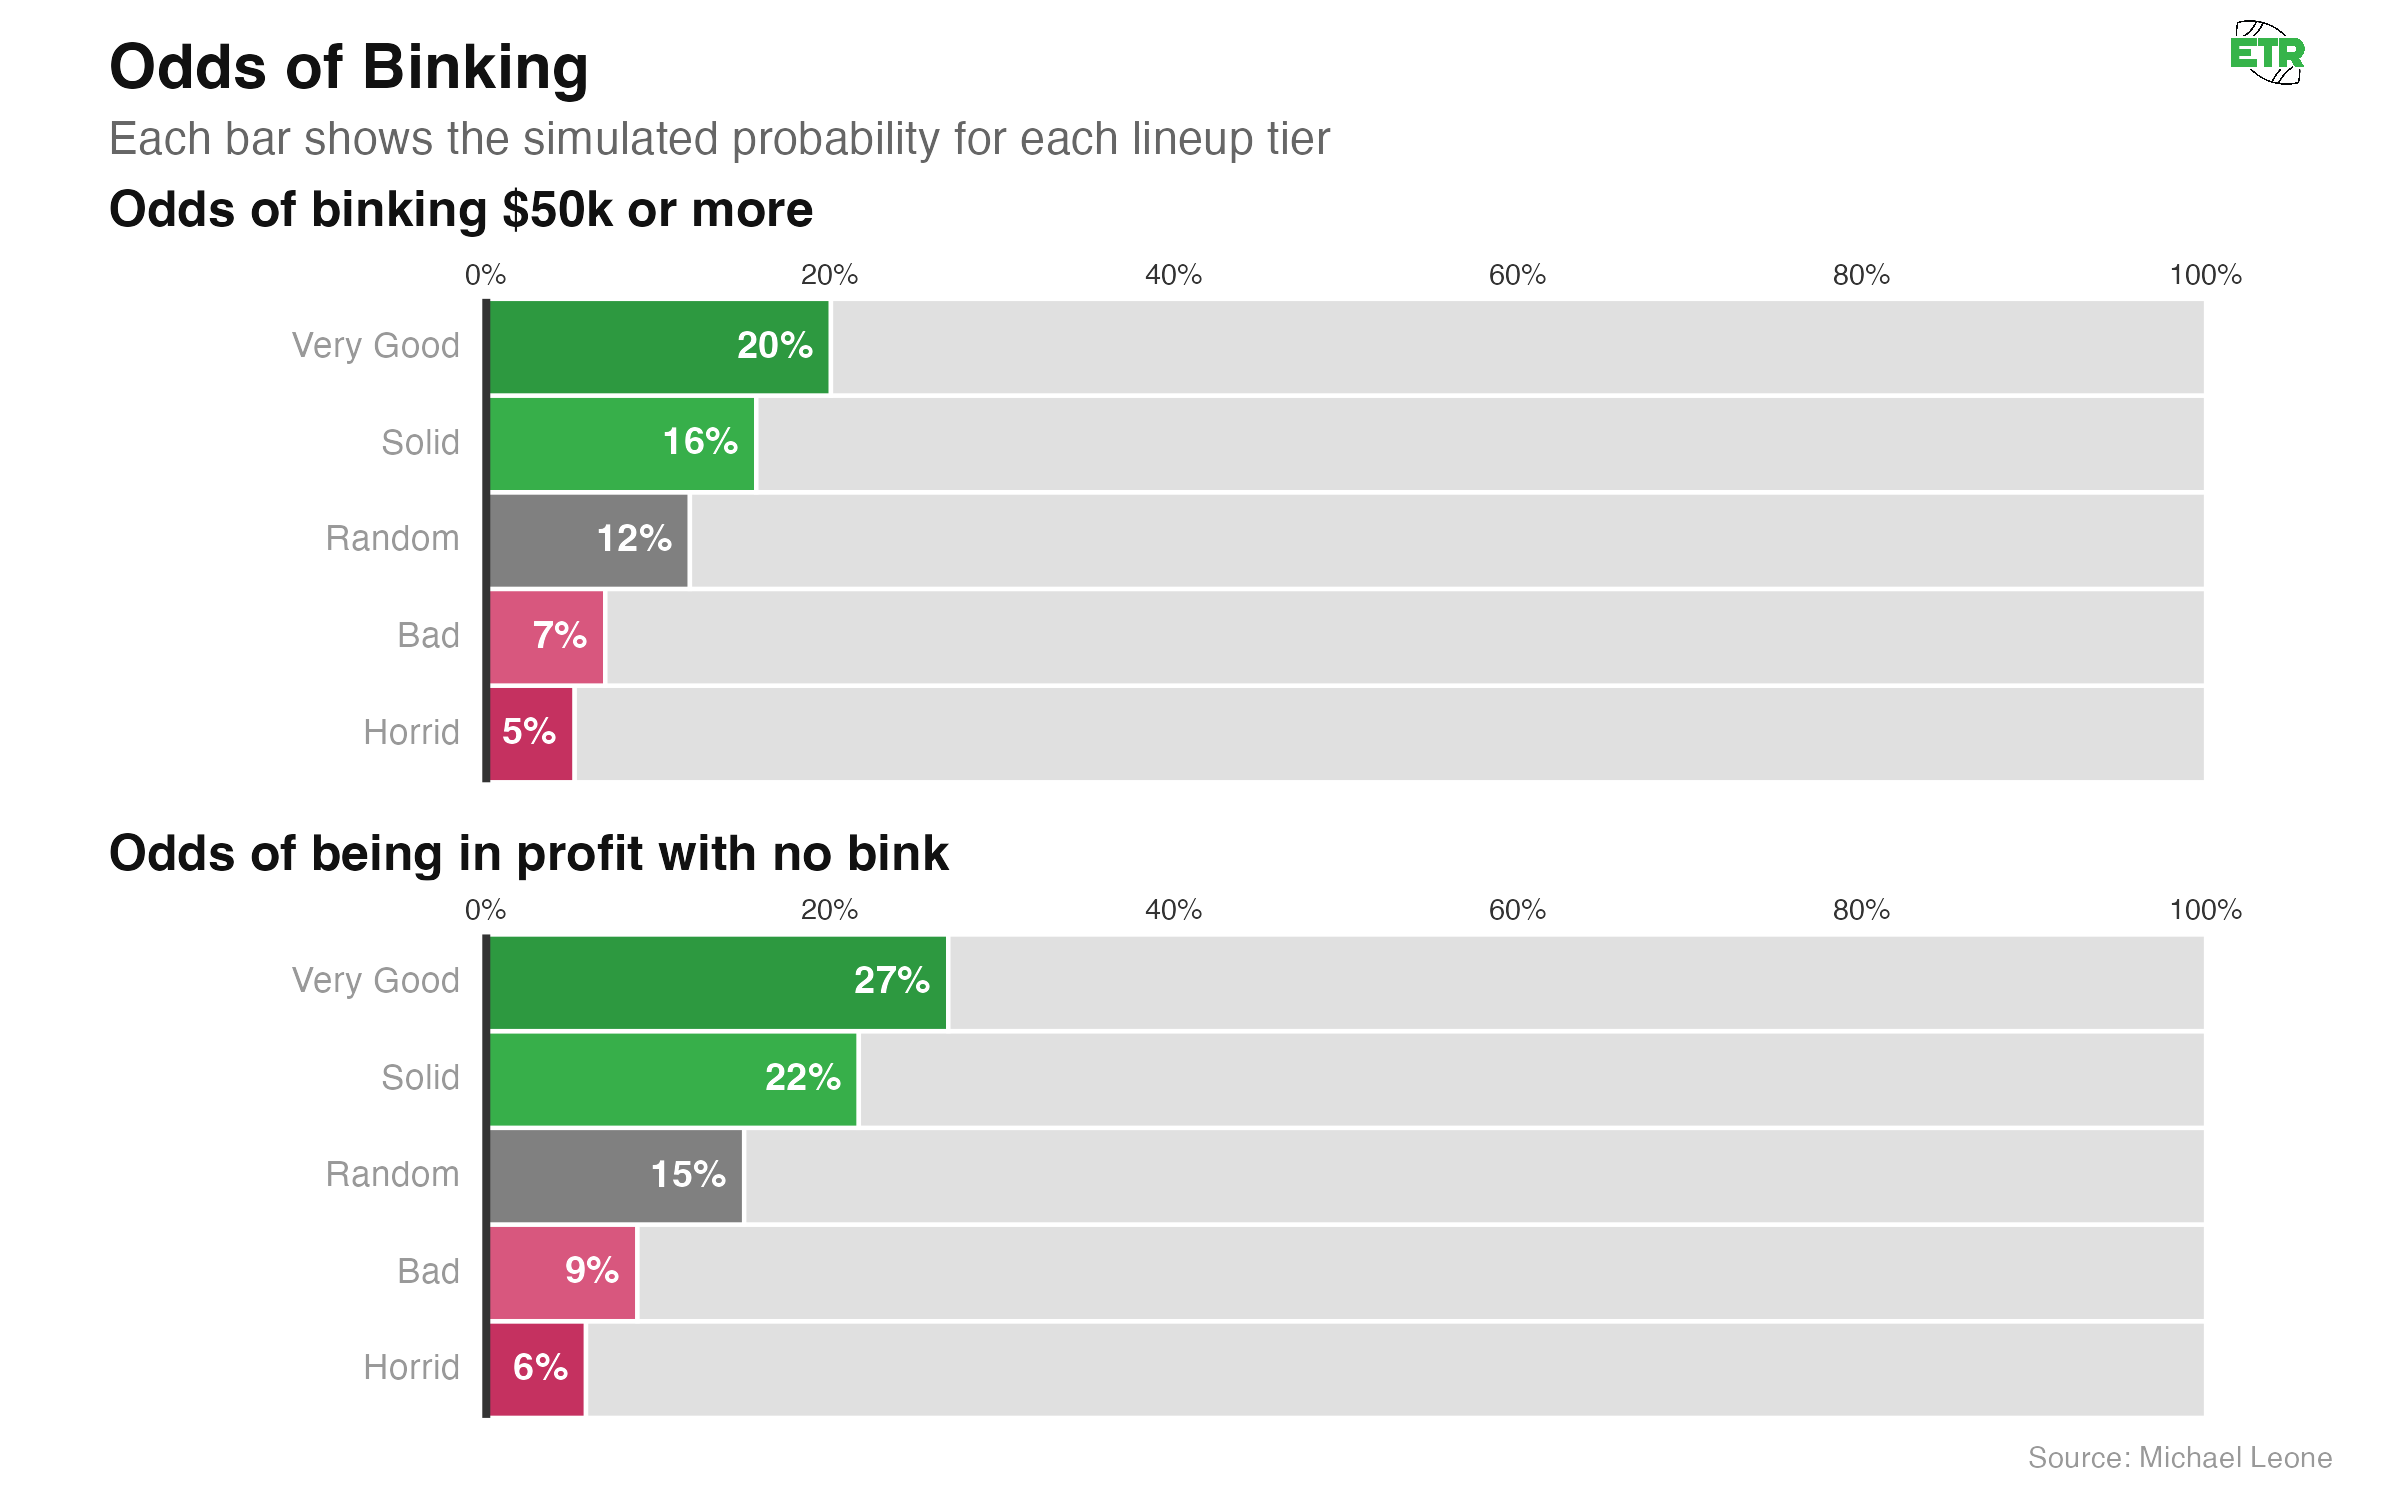
As daunting as the low profit probabilities and high chances of losing multiple seasons in a row are, the flip side of variance is that binking is somewhat attainable over a full season in a contest of this size.
On an individual week, of course, it’s very difficult. Just 0.68% of all lineups played in the GC over the 35 weeks we looked at “binked” by our definition. This actually allows us to validate our prediction model and bankroll simulator. If you assume something has a 0.68% chance of happening over a single trial, the odds of that thing occurring over 18 independent trials is 11.6%, pretty darn close to the probability assigned to our “Random Expectation” lineup in the bankroll simulator.
Over a full season, the edges on good lineups compound, and you’re able to get that up to 20%. So you’re roughly equally as likely with a “Very Good” lineup to bink in an individual season as you are to string together three consecutive losing seasons.
The “Bink” graphic also shows the odds a team is profitable in seasons they do not bink. In general, this ratio is pretty similar across all lineup types: A lineup sees a ~40% reduction in odds of being profitable relative to its baseline rate when it does not win a prize of >=$50,000 in a given season. Better lineups are a bit more robust.
Put another way, for the “Solid” lineup, the probability of profiting is 34% in a single season, but that probability drops to 21.7% without a bink. In essence, 39% of all single-season profitable outcomes for the “Solid” lineup are the result of a bink. This ratio is similar for all lineup types, though the percentage drops slightly for the worse lineups.
Odds of Going Bust
For the following graphic, I calculated the risk of ruin in our bankroll simulations. Ruin means that a bankroll hits $0 at any point. I assumed an initial bankroll of $30,000. It’s a subjective assumption that felt right (20x one week entry fee; more than the total yearly buy-in for a weekly GC entry, which sits at $27,000).
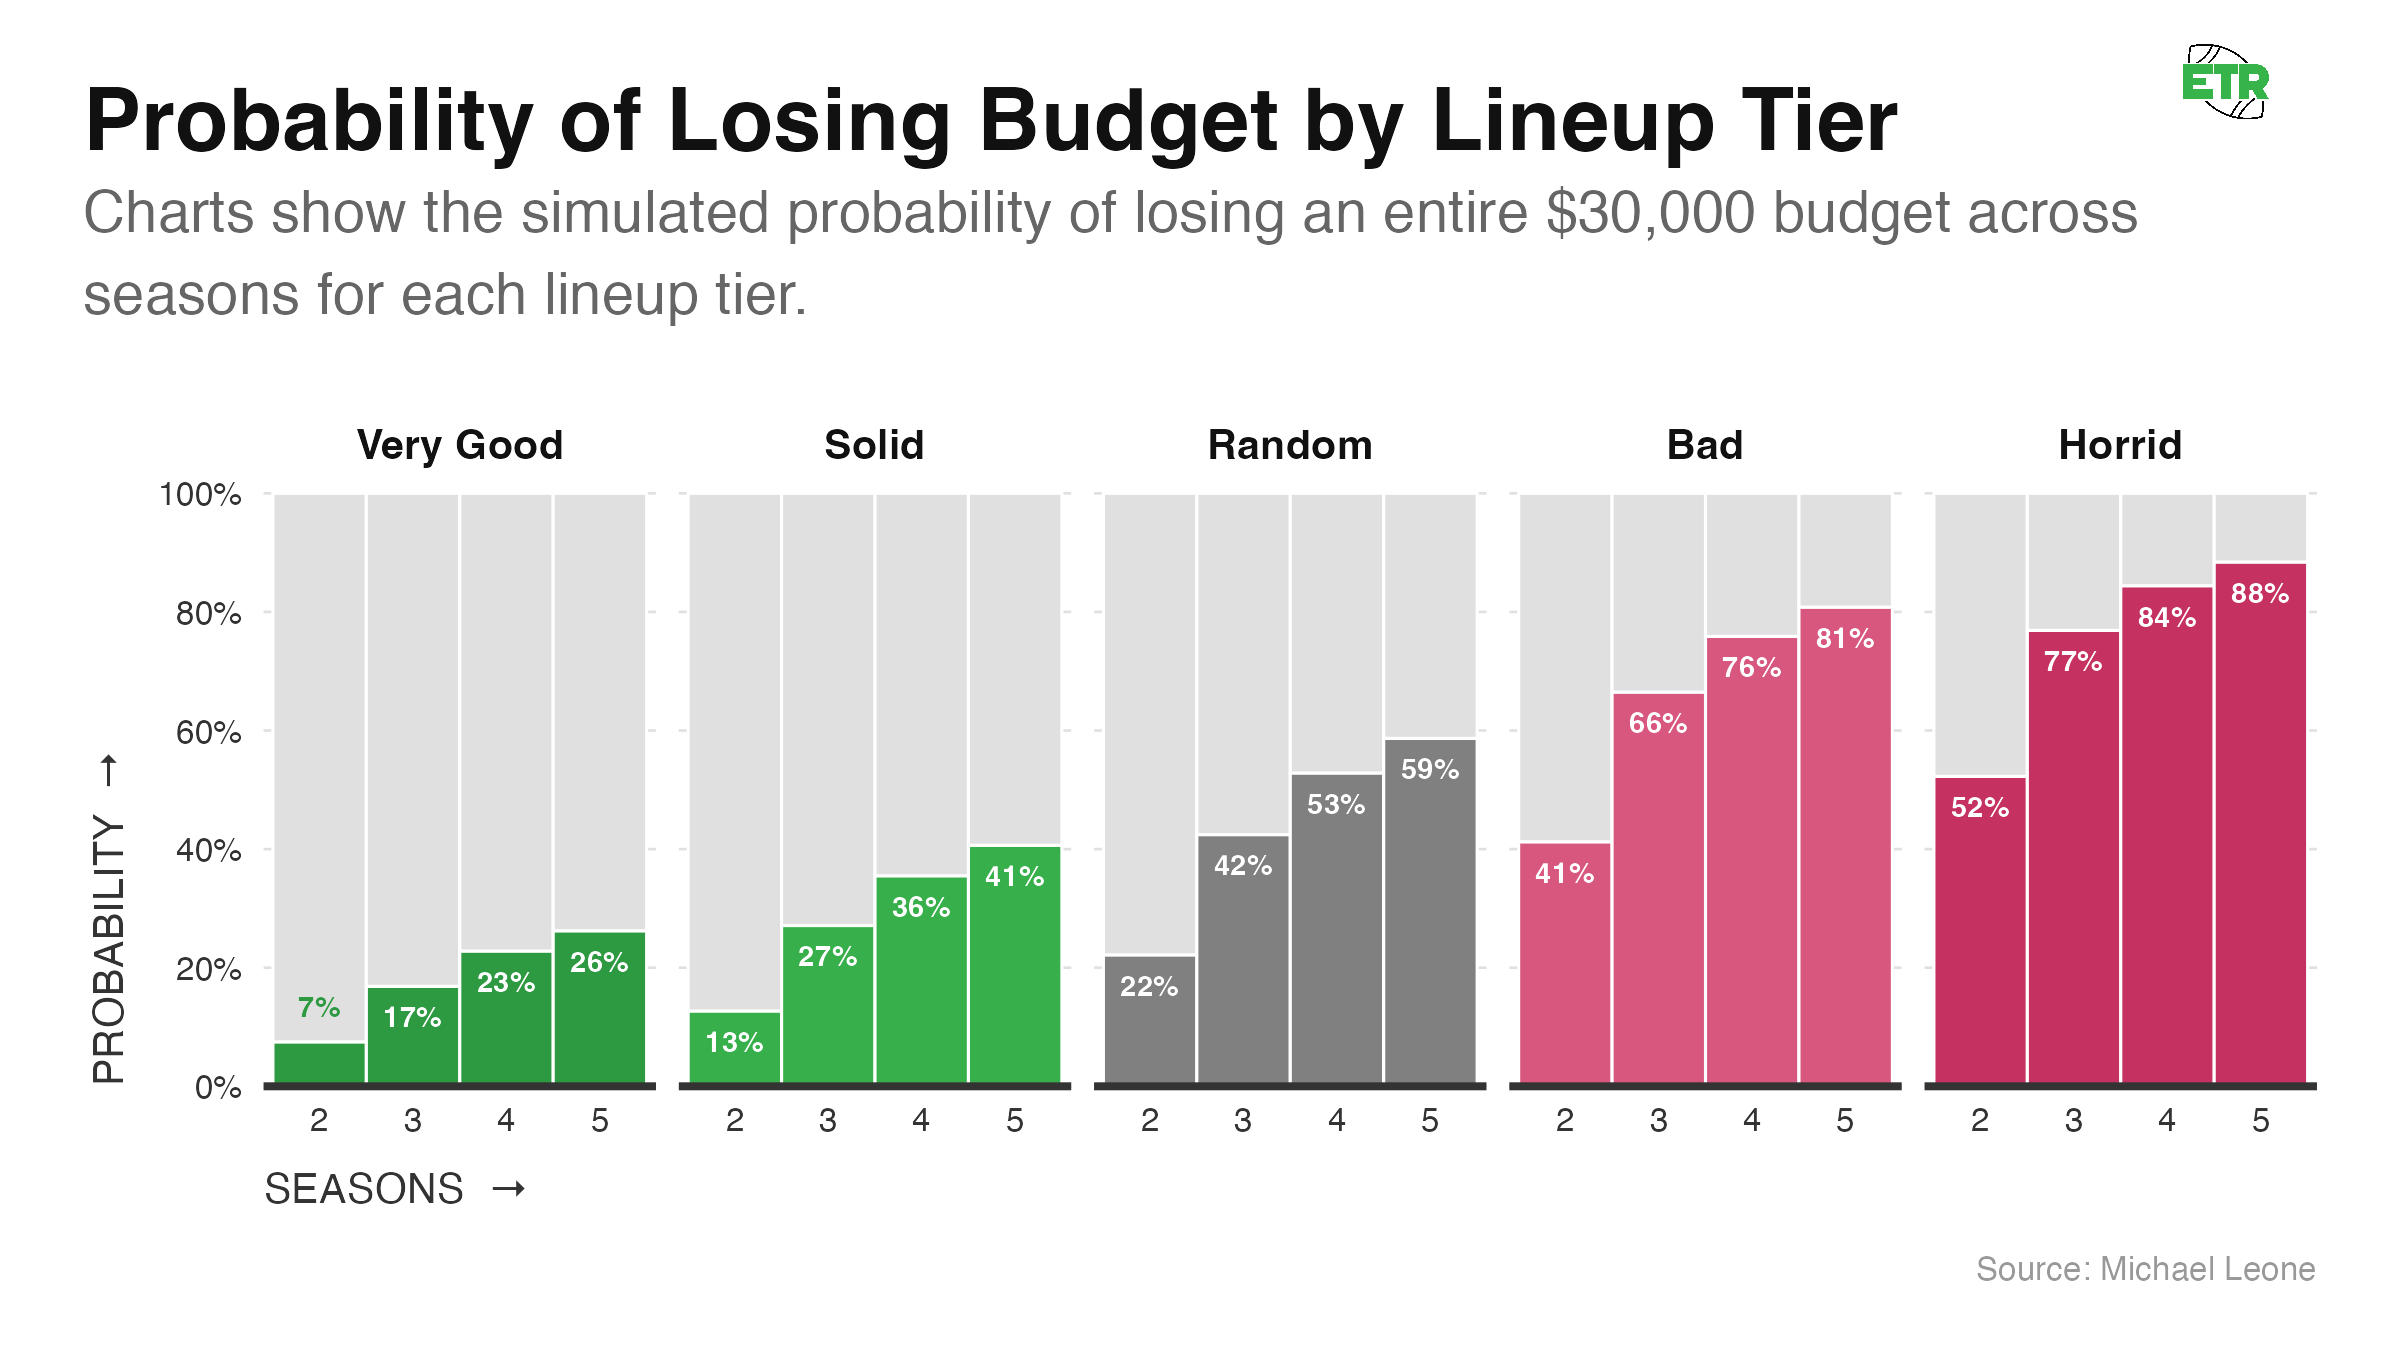
To be able to make a better comparison, let’s look at the probabilities that a lineup is either profitable, busted, or underwater (not profitable but bankroll > $0). For this exercise, unlike in the Odds of Profit/Losing sections above, we’ll assume a lineup stops playing once it busts.
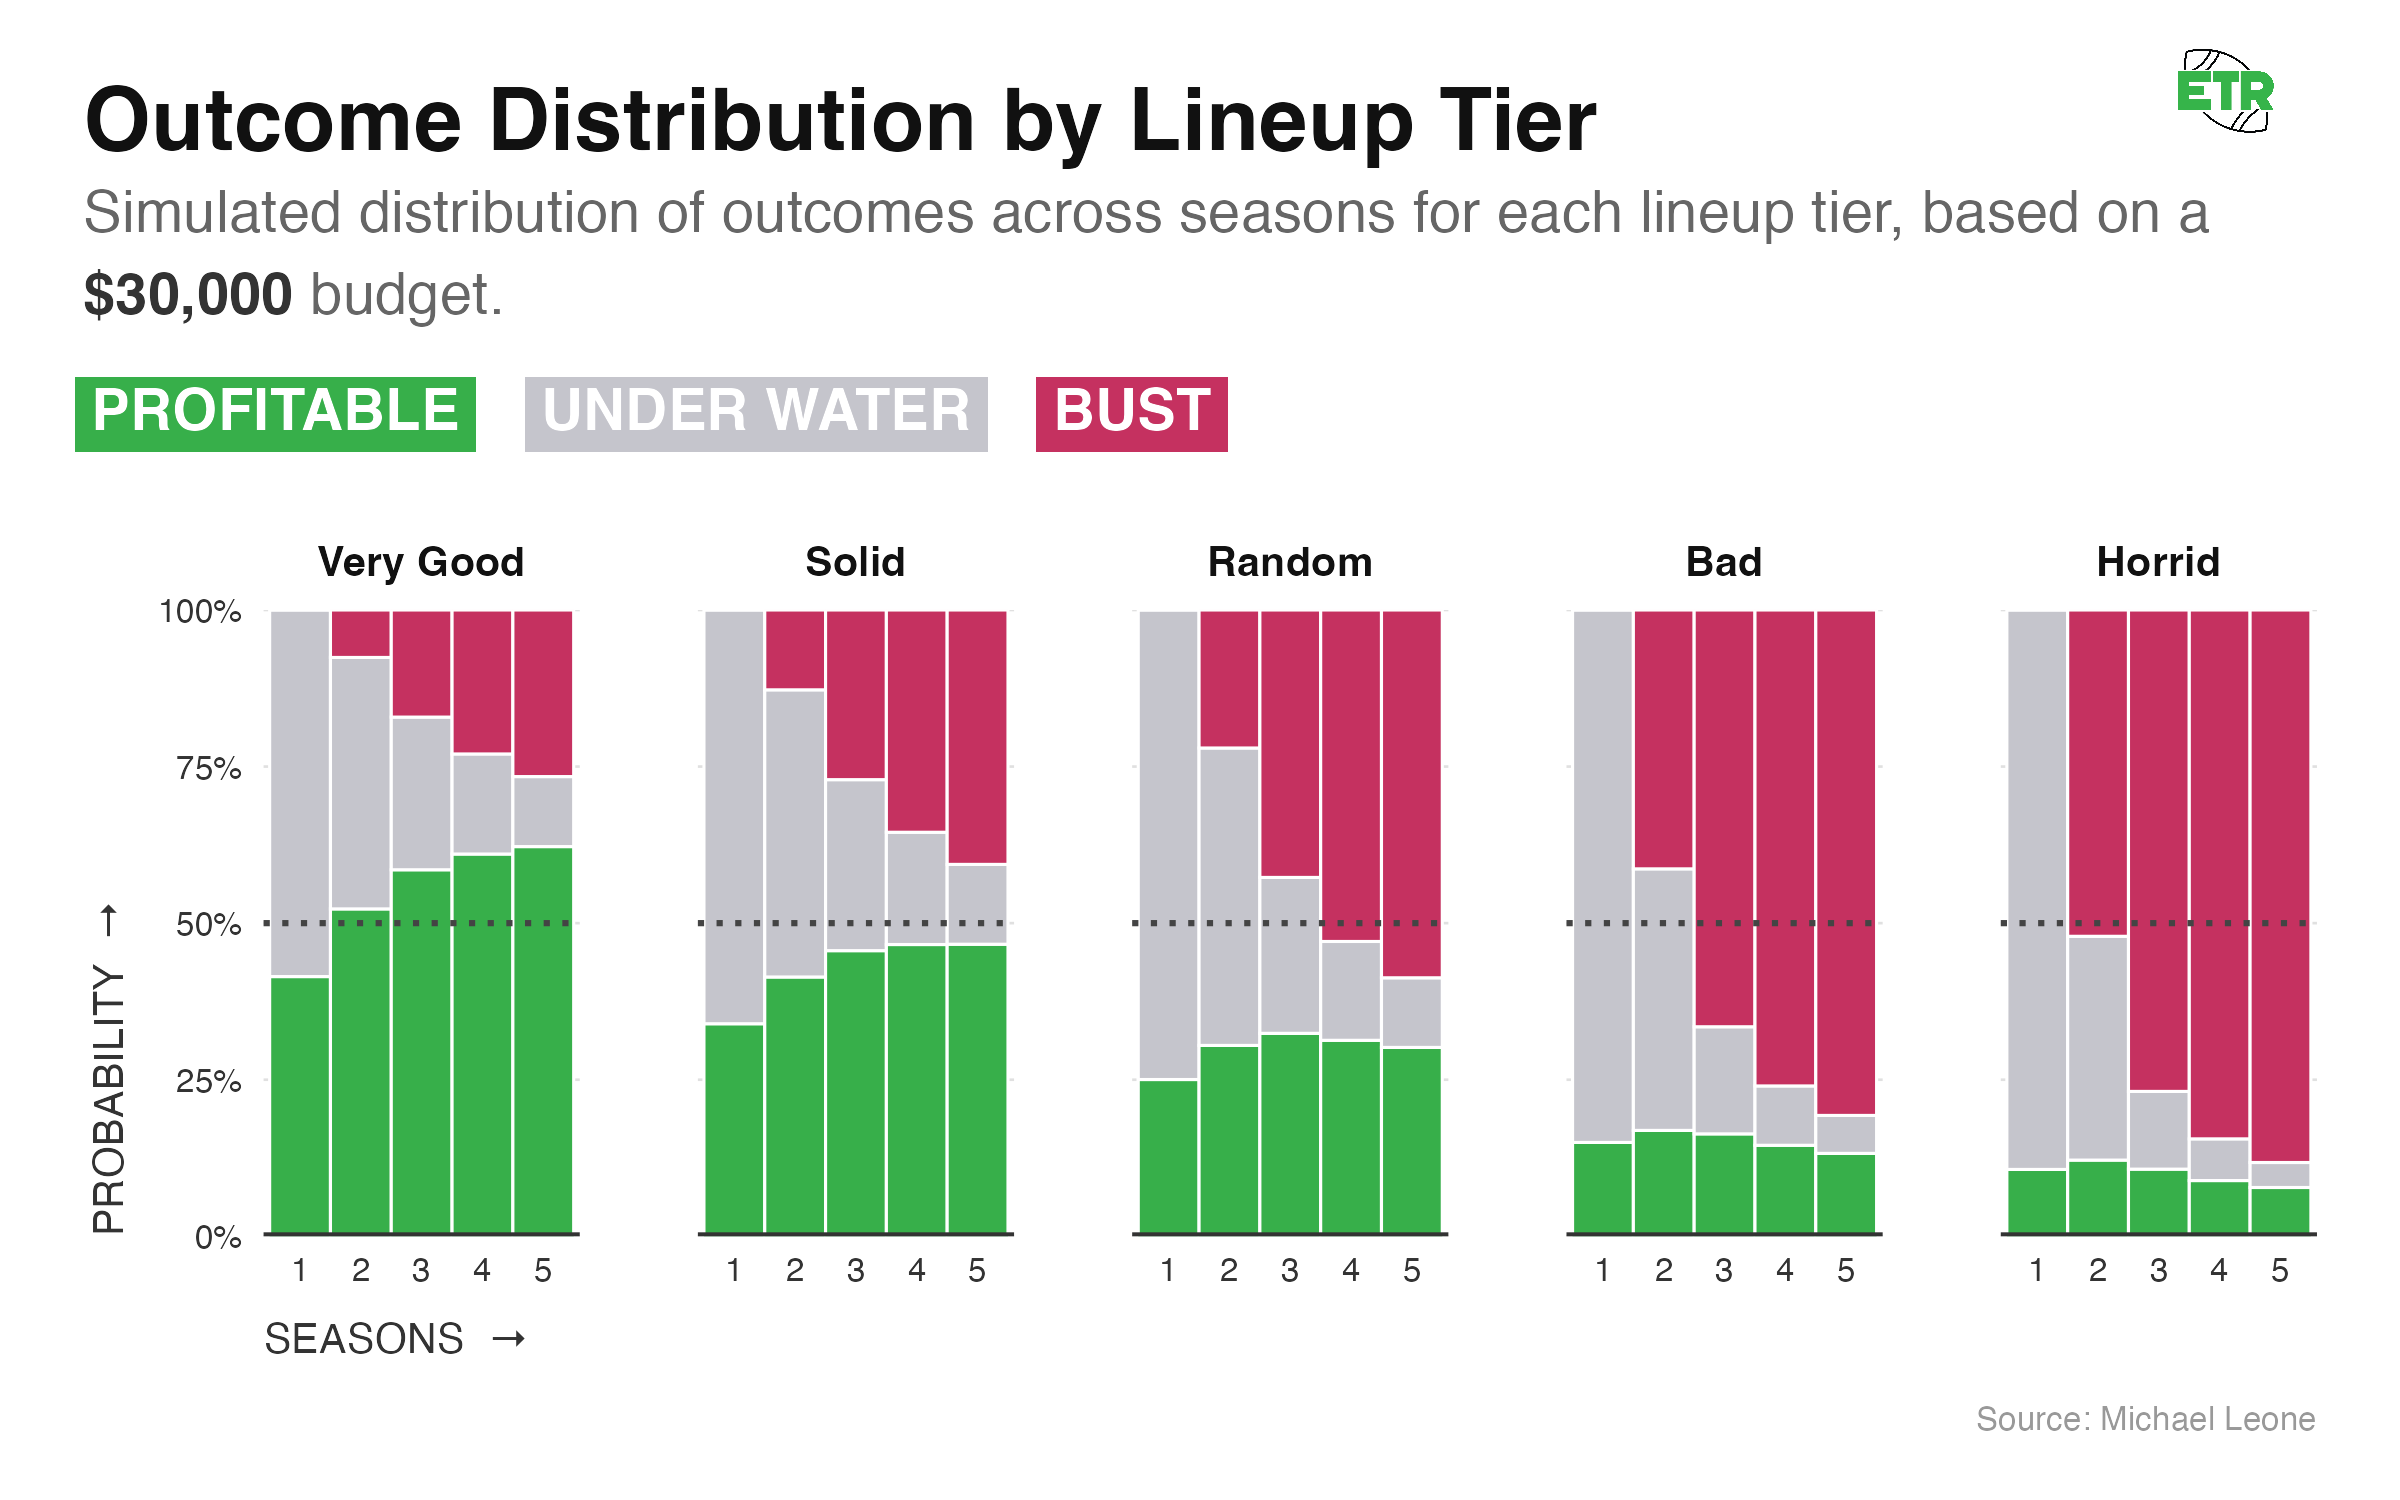
Notes:
- For all lineups, the odds of being profitable over X seasons are reduced once you assume that the lineup stops being played when the initial bankroll is gone. For example, earlier in this section, we saw that a “Very Good” lineup had a 69.4% chance of being profitable after five seasons. That drops to 62.2% when you remove the outcomes where the lineup busted (lost the initial $30,000 bankroll) and then went on to become profitable if you were to keep playing anyways.
- The binary nature of playing a high-variance GPP with a limited bankroll is on display here. For most lineups, you’re either profitable after five seasons or you’ve busted. On average, only 9% of lineups are losing but still possess a non-zero bankroll after five seasons.
The binary nature disappears if you were to double that bankroll from $30,000 (20x weekly buy-in) to $60,000 (40x):
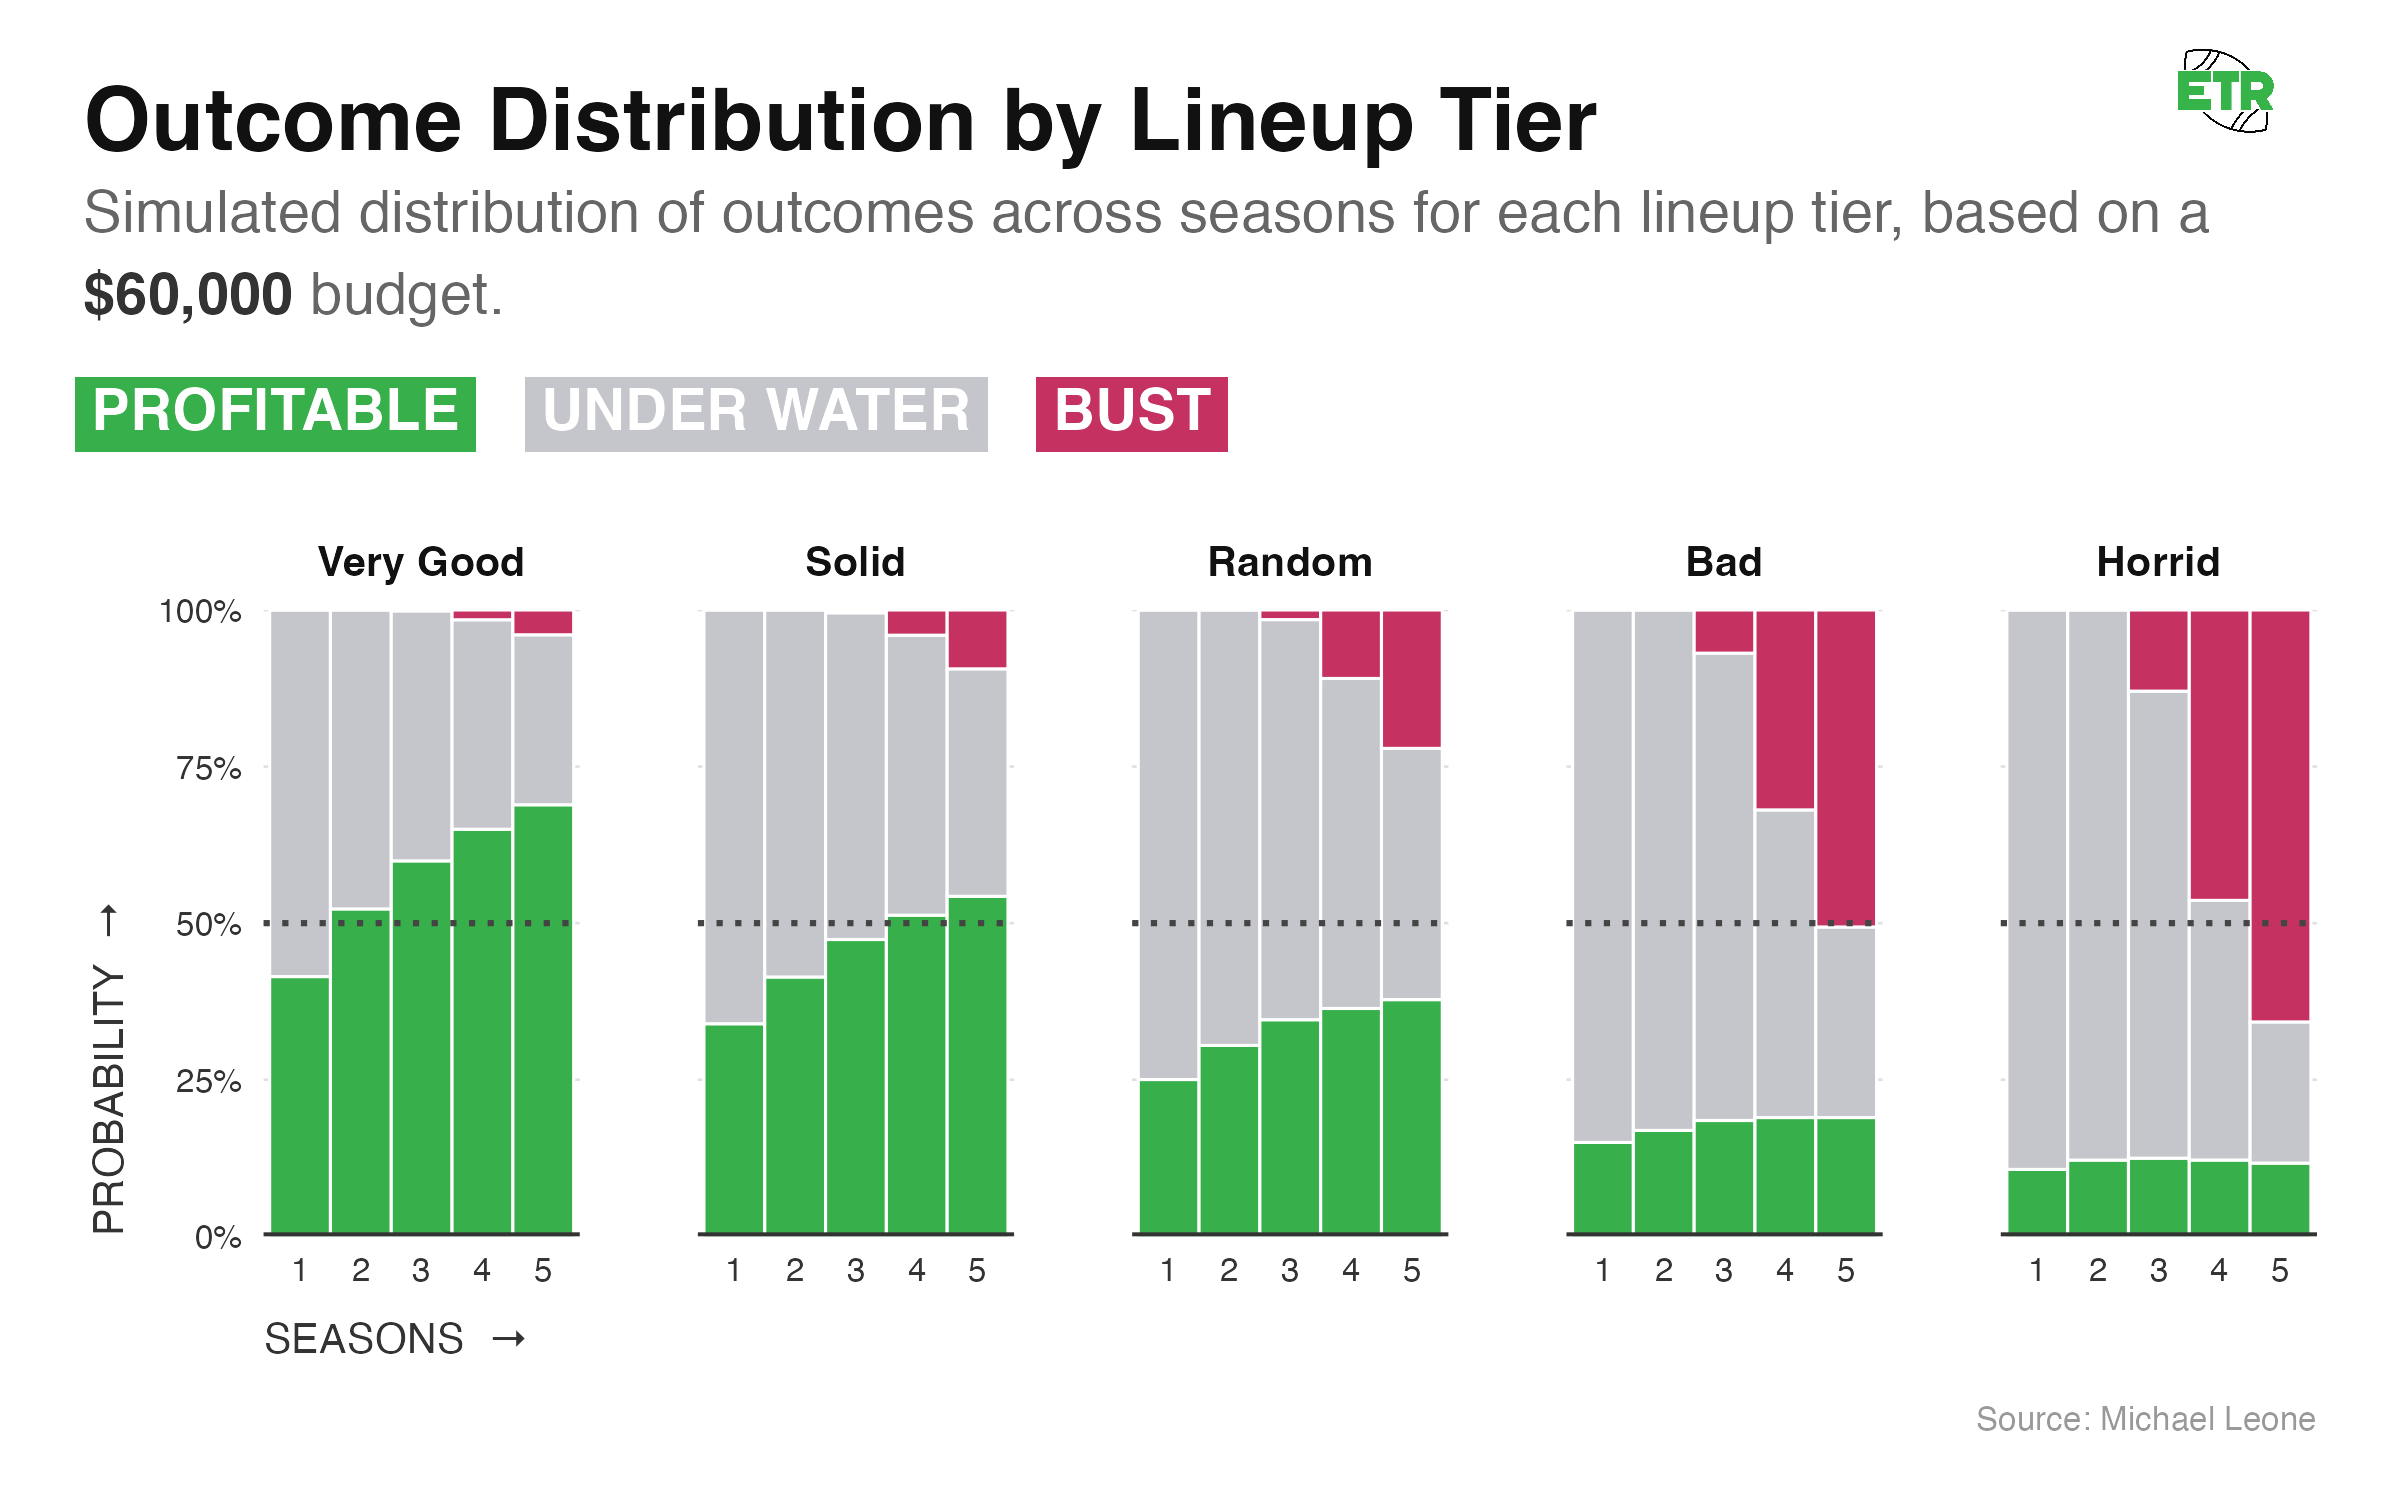
At this point, it’s unlikely (sub-10%) that a good or great lineup goes bust, but a bad lineup is still on the wrong side of a coin flip.
Simulating Potential Bankroll Outcomes
I know most people likely approach their bankroll season by season. The graphic below is interactive and allows you to visualize various outcomes after X seasons if you start with a $15,000 bankroll (10x entry fees) and:
- Stop playing in a given season if you go bust
- Play the next season regardless
- Roll over your previous end-of-season bankroll.
- Restock your bankroll up to $15,000 the following season (if necessary).
Conclusion
I hope the above information is helpful to grasp realistic bankroll expectations and to truly understand how variant this game is, even when playing good lineups. I suspect most people who are reading this and using ETR Solver sims are playing something most akin to the “Solid” lineup above.
If so, that means (based on past data) you’re expected to churn out a 16% ROI over time, which is fantastic. However, that simultaneously means you’re only going to make money roughly one out of every three seasons and aren’t too much better than a coin flip to avoid having back-to-back losing seasons.
It’s worth reaffirming that the Game Changer contest that the bankroll simulator is trained on is a high stakes, small field contest that is likely tougher than the average DFS tournament field. The attainable ROI there may be worse than you can achieve in other fields, which will affect your variance. Seeking out small field, smaller stakes contests is a good idea if you are trying to reduce your variance (or if you feel that’s where your edge is). Conversely, it may be possible to realize a larger long-term ROI playing large field tournaments, albeit with the potential for even wilder bankroll swings than analyzed above.
All things equal, you should play a mix of contests to give yourself more shots on goal and more ability to diversify each week. In reality, you have to consider where your individual skills lay and how many different types of contests and total lineups you can manage weekly without sacrificing a drop off in post-lock ROI.
In Part 3, I’ll combine what we’ve learned so far with my experience using the sims to develop several heuristics to help ensure that A) your teams sim well post-lock and B) those teams are good in reality.
Part 3: How to Make Good Lineups Using DFS Sims
Making teams that sim well post-lock
This article is devoted to the ideas that teams with strong post-lock sim ROIs will win over the long run. However, for that to matter, you need to make teams that sim well post-lock in the first place.
Sim Well Pre-Lock
The obvious first step is to use The Solver sims to make teams that sim well pre-lock. The pre-lock sims are very directionally accurate in terms of how lineups will sim post-lock. They aren’t always precise, however.
By that, I mean, in general, the best simulating lineups pre-lock will be among the best simulating lineups post-lock. But the actual simulated ROI will likely regress from pre- to post-lock. Why? The first reason is it’s incredibly difficult to get the field lineups exactly right. We’ve put a lot of work into this and do a good job overall (or else the pre-lock ROIs would not be correlated to post-lock), but it’s likely that the actual field lineups end up a bit more competitive than the projected field lineups.
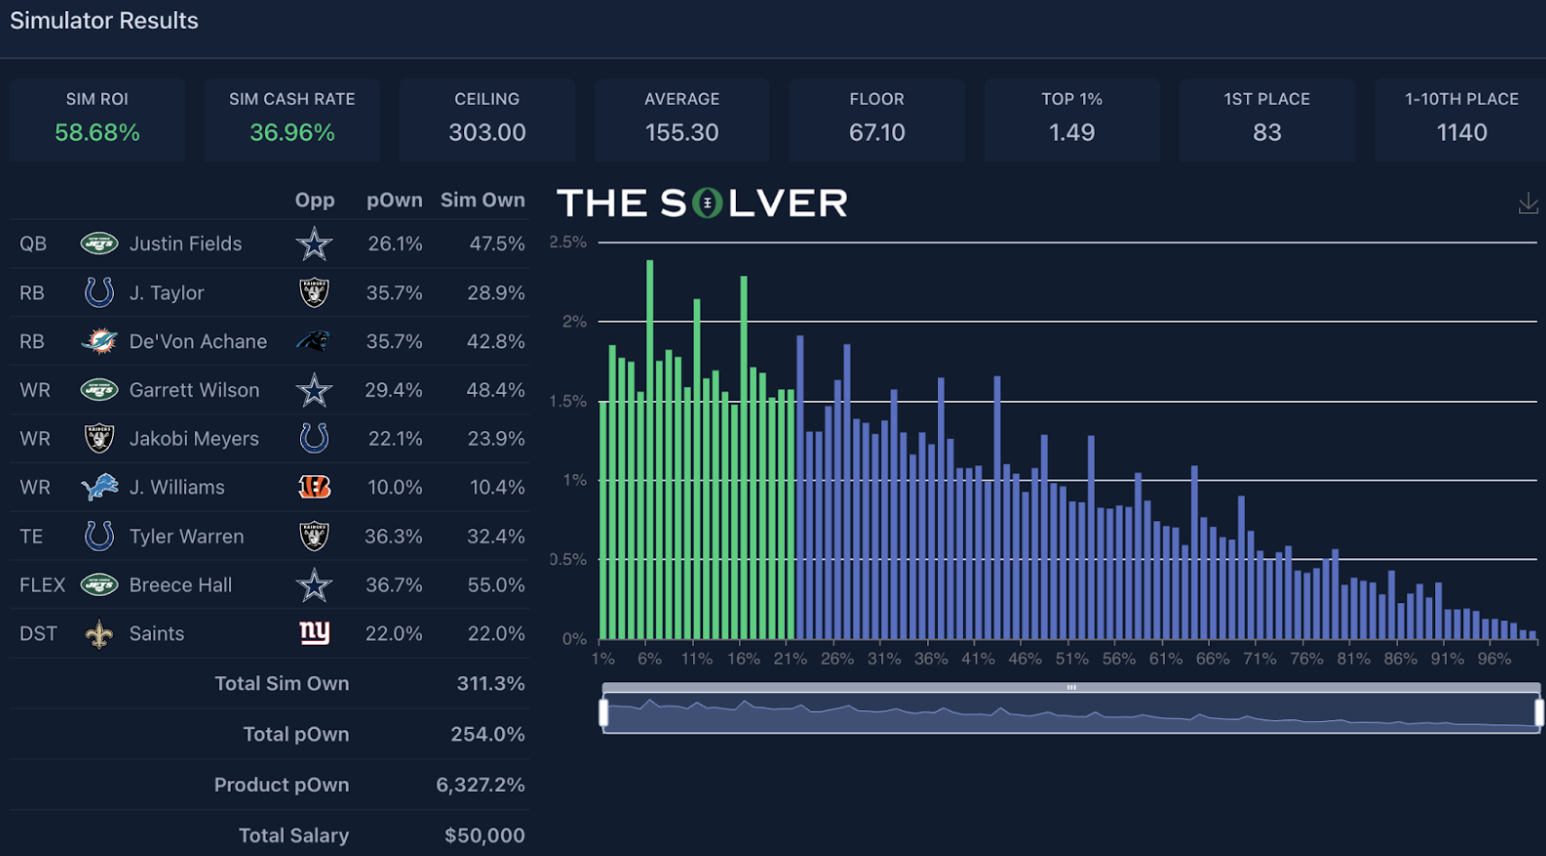
As an example, here are 14 test lineups I saved from Week 5 of this past season that simulated the best in the Game Changer pre-lock:
And here is how they simulated against the actual field:
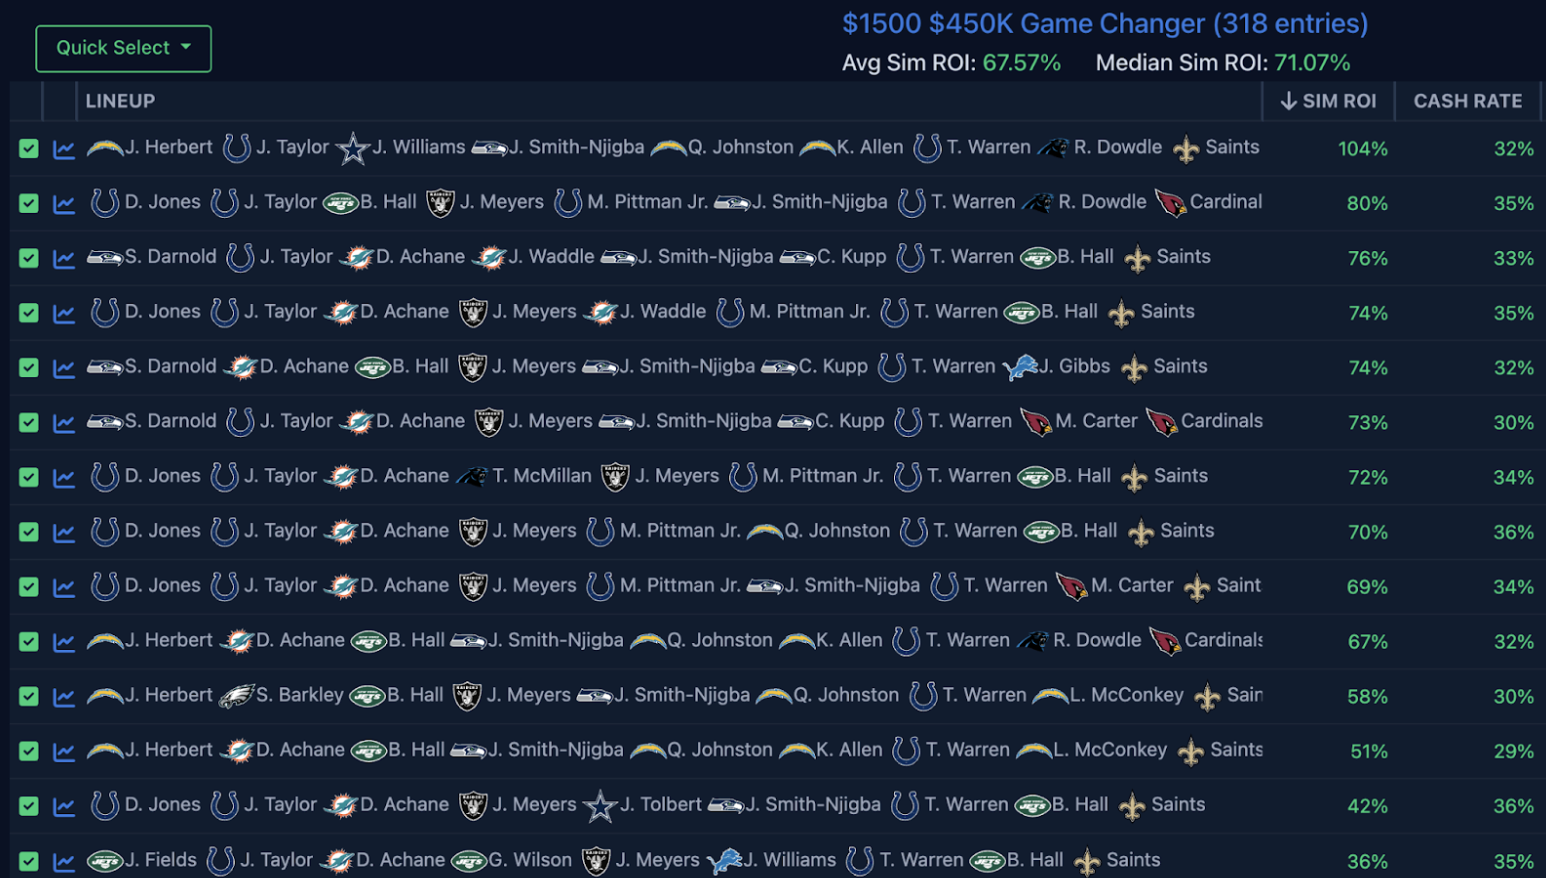
Two observations:
- The mean and median ROI of these 14 lineups dropped ~20 points from pre-lock to post-lock.
- All of these lineups, except one, still simulated at 40% ROI or greater post-lock. If you recall from Part 1, that places these lineups in Bucket 1 (the best bucket of post-lock ROI teams), where teams over the past two seasons realized an average actual ROI of 38%.
So, will the pre-lock sims be perfect? Absolutely not, and I’ll talk about how to deal with that as we proceed through this article. But will they be useful? Unequivocally. The first step to making teams that sim well post-lock is to make teams that sim well pre-lock.
Read the Ownership Tea Leaves
We do want to avoid playing the teams that are susceptible to losing a lot of simulated ROI from pre-lock to post-lock, and in order to do that, we have to get good at reading the ownership tea leaves. Our overall ownership projections are dialed in, but imperfect.
One, there will be weeks we miss on a few players and have a bad read overall. Two, ownership can vary quite a bit from contest to contest, even if the structures and sizes of these contests seem similar. A 3-max, small-field contest with 300 entrants may see very different ownerships than a single-entry contest with the same size and payout structure.
These ownership misses, whether due to an ETR error projection or contest-to-contest variance, are going to change how a lineup simulates post-lock.
If we go back to the Week 5 Game Changer example I just shared, comparing pre-lock to post-lock simulated ROIs, we find two lineups with simulated ROIs that changed most meaningfully from pre-lock to post-lock.
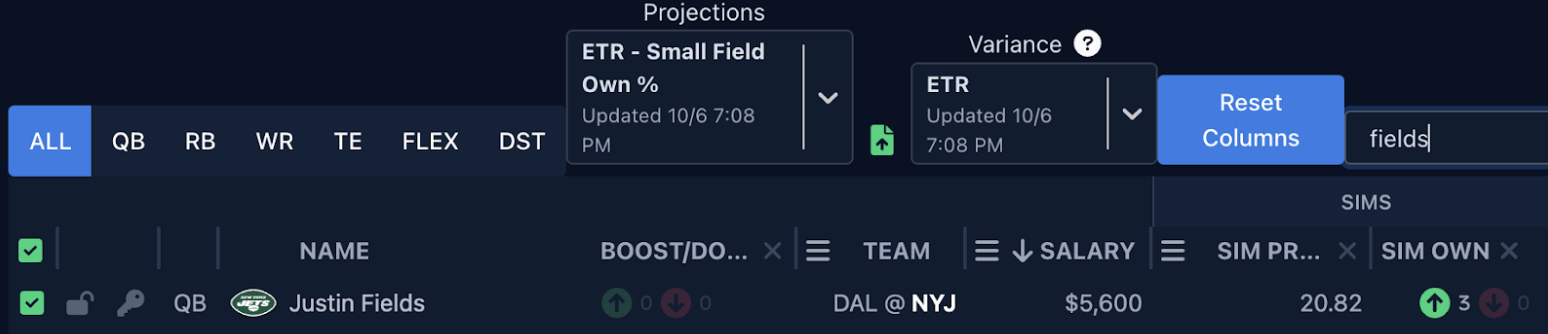
This Justin Fields lineup saw its ROI plummet the most from pre- to post-lock.
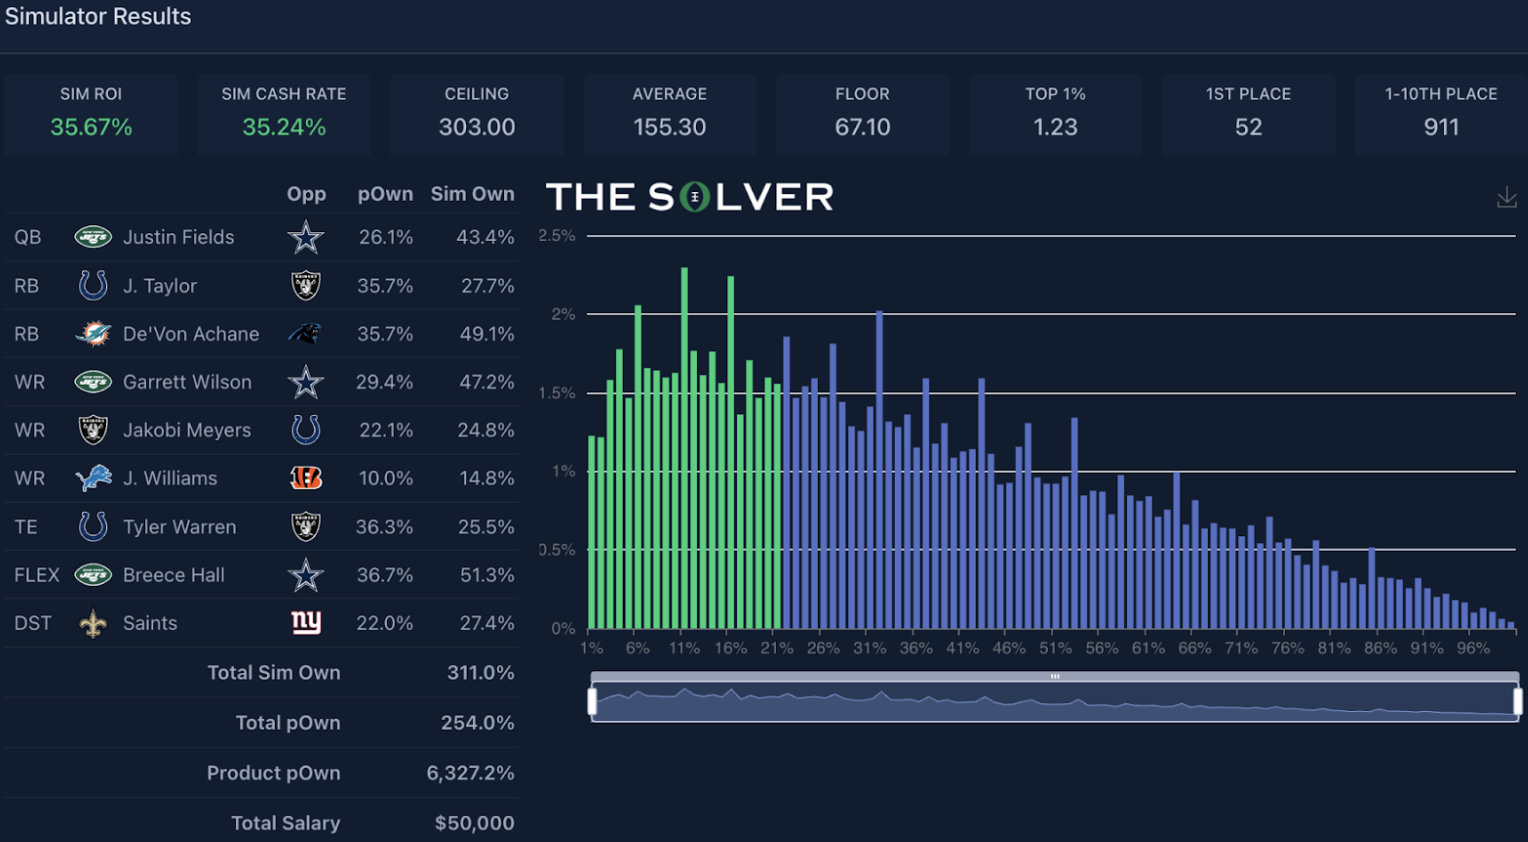
And it’s pretty easy to see why:
- The total sum ownership of the lineup went from 264.5% to 311.0%.
- The primary stack ownership went from a simulated 25.8% (Fields) and 30.8% (Garrett Wilson) to 43.4% and 47.2% in actuality.
- The collective RB ownership, which was already quite chalky at 115.7%, rose 12.4 points.
- Breece Hall’s ownership coming in higher than expected impacted both the stack ownership additionally and the collective RB ownership noted.
- The ownership of the primary “differentiator” player (Jameson Williams) almost doubled (8.2% to 14.8%).
There are times you can survive the ownership of a lineup coming in higher than you expected, but this one went 0-for-3 on things I like to look at:
- Ownership of the correlated pieces
- Combo ownership on the chalk pieces
- Ownership on the differentiation piece
On the second bullet above, it might seem immaterial, if you’ve already committed to playing chalk because it’s good chalk, for De’Von Achane and Breece Hall to go from 78% total ownership to 100.4% total ownership. But if we quantify how many other total lineups you’re competing against, you start to see why it matters so much.
Pre-lock, there are an estimated 48 teams with that combination (15.2%). In actuality, there were 80 teams with that combination (25.2%). That’s a huge difference.
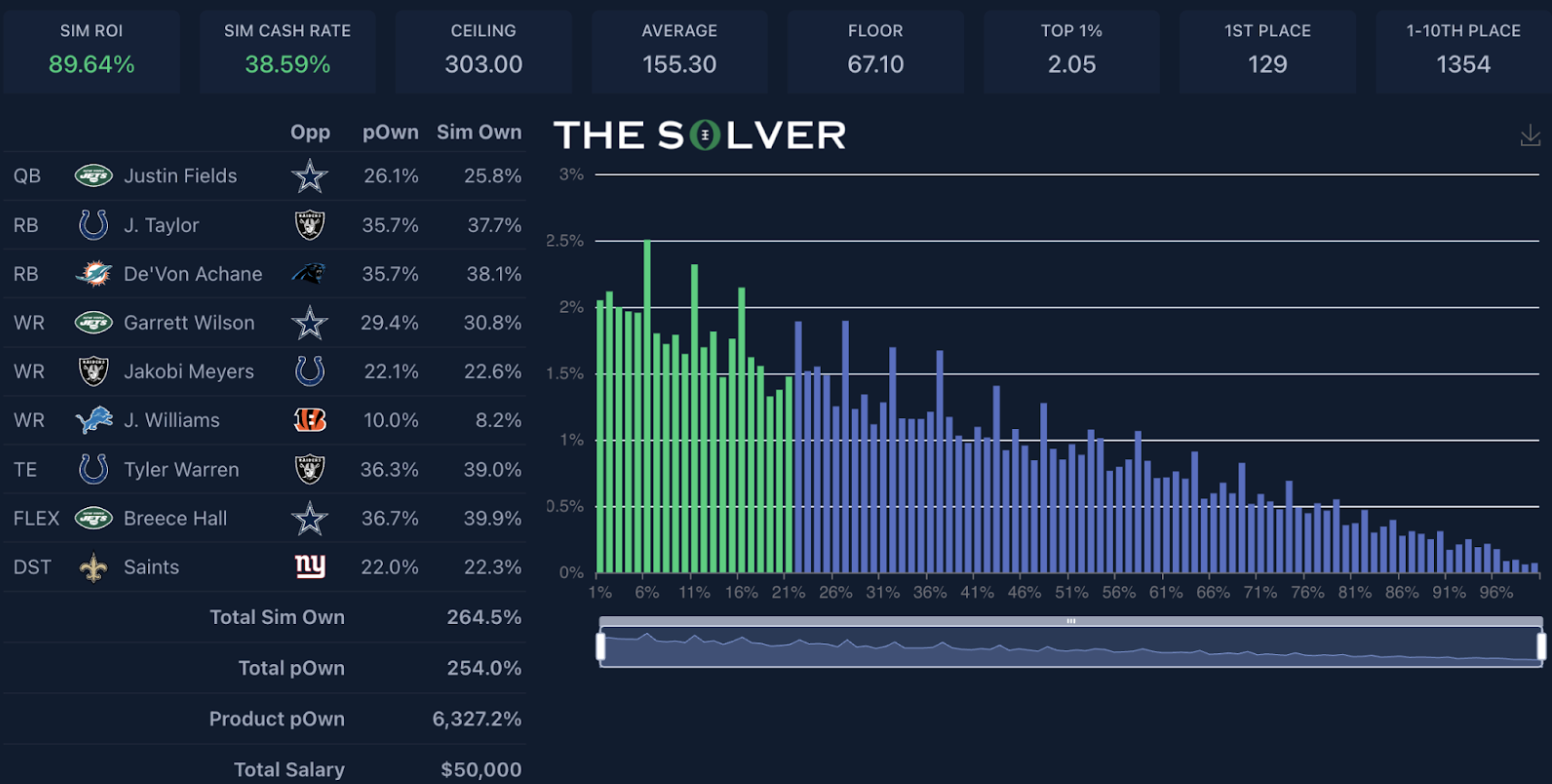
This Justin Herbert lineup saw an increase in its ROI from pre-lock to post-lock:
In terms of the checklist of three things I like to look at post-lock, it went 3-for-3:
- Individually, each piece of the Justin Herbert stack came in at an actual ownership less than what was simulated pre-lock (ownership of the correlated pieces).
- The combo ownership on the main chalk pieces was pretty steady (particularly Jaxon Smith-Njigba + Jonathan Taylor).
- The ownership of the lowest-owned player came in at 3.5%, well below the expected 8.2% (differentiation piece).
I think it’s important to try and play similar contests somewhat consistently. You don’t want to be inflexible in your routine, because each week in DFS is unique and may require playing different contests to best take advantage of where you believe the edge to be. Yet it’s clear that if you have a good feel of where ownership is headed, you’re going to be in a much better position to avoid playing lineups that see their post-lock ROI crater relative to pre-lock.
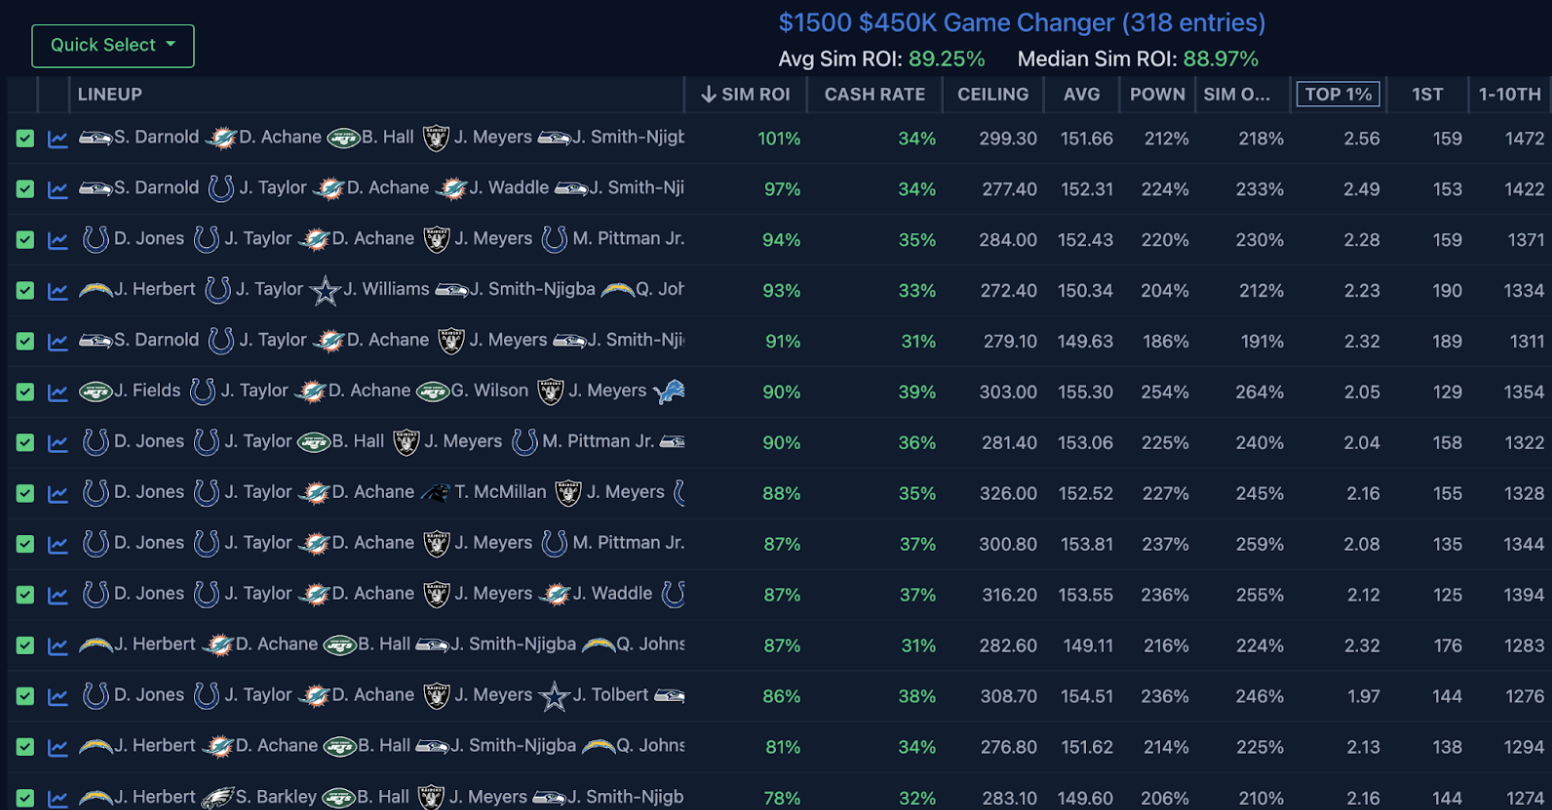
The Solver has added the ability to boost or dock simulated ownerships, so pre-lock you can test how changes in ownership may affect the simulated ROIs of lineups. In the Justin Fields lineup above, I went back to Week 5 and boosted the ownership of Fields-Wilson-Breece in the Jets stack along with some other pieces to get it more in line with how ownership actually turned out. You can see that even pre-lock, the ROI dipped when doing so:
A Note On Pre-Lock Sim Metrics
When using the sims on The Solver, I quite often get questions from subscribers along the lines of: “Which metrics do you pay attention to?” The metrics subscribers are referring to are the descriptive statistics generated after simulating lineups in a contest. Here are those Week 5 pre-lock Game Changer lineups again, this time expanded to show all of these metrics:
These are the primary columns to focus on:
- Sim ROI
- Cash Rate
- Top 1%
- 1st
- 1-10th (aka Top 10)
I’m not including the AVG or CEILING columns because I don’t care how many points my team scores on average or can score. All we care about is beating our competition. Sometimes that comes from scoring a boatload of points, but other times it comes from winning low-scoring slates. So, to me, these columns are irrelevant.
In a perfect world, you’d only have to worry about the sim ROI column. This is all we care about over the long run. But there are some reasons not to solely rely on this column.
One, in a real-world example, people also care about making their bankroll last. It’s not unreasonable for someone to choose to play a 32% projected ROI lineup with a 34% projected cash rate over a 41% projected ROI lineup with a 23% projected cash rate in order to smooth out the variance a little bit. We don’t get to play these lineups thousands and thousands of times to ensure we realize our theoretical ROI.
Secondly, ROI is heavily dependent on winning contests. Now, this is plainly important. You have to make teams that have a better chance of outright winning a contest than the rest of the field. This is where the majority of your edge comes from. However, the sims are not perfect, and there’s going to be some noise in if a lineup finishes first 13 times in a simulation versus 11 times that’s tough to predict with a high amount of precision. Yet, the difference between winning two more times or not can have a massive impact on the simulated ROI and either overstate or understate the potential prowess of a lineup.
In the past, I’ve mostly relied on simulated ROI, but moving forward, I’ll likely focus a bit more on the Top 10 and Top 1% columns, which show how often a lineup finishes in the top 10 of a contest (raw) or among the top 1% of all entries (percentage). It’s important to know that what these columns are measuring isn’t stable from contest to contest. There’s more noise in predicting if a team will finish top 10 out of 30,000 teams versus top 10 out of 300 teams. The Top 1% column is a bit more stable, which is why I’ve included it, since it is percentage-based. But the amount of lineups you have to beat to finish top 1% of 30,000 rather than top 1% of 300 still changes the calculus.
A major reason why I’ll focus more on the Top 10 column moving forward is the results of the previous two parts of this article. In Part 1, we bucketed the cash rate, top-10 rate, and ROI metrics in order to measure how calibrated they were with actual results. The cash rate buckets showed a clear linear trend between simulated and actual, but it struggled with outliers. The teams with the highest of the high simulated cash rates saw much lower actual cash rates. The ROI buckets were directionally accurate but showed less precision. The top three buckets by simulated ROI all had similar actual mean ROIs.
The Top 10 results showed the best combination of the clear linear trend the cash rates had, with less deterioration in calibration on the outlier high teams. Focusing on top-10 results also makes sense as a way to capture the upside of a team (we know it has to be able to win to have a strong actual ROI) while removing some of the noise in trying to predict if a lineup can finish specifically first overall.
It’s worth pointing out here that in the Bankroll Simulator Model I created in Part 2 where I lumped in Cash Rate, ROI, Top 1%, and Top 10 metrics as predictor variables, the Top 10 metric held meaningfully more sway on the results than Cash Rate. It’s absolutely possible this is the result of an overfit model, but from a descriptive standpoint, simulated top-10 finishes were very important to actual results over the past two seasons in the Game Changer contest specifically.
Unfortunately, there’s not a golden ratio of how to combine these pre-lock sim metrics in order to find the perfect lineup. No matter how you use the sims, the final lineup determination is more art than science, which brings me to my next heuristic.
Sim Hack Intelligently
“Sim Hacking” is my term for backing into all the combinations the simulations like pre-lock until you “crack the code” and find the best possible simulating lineups for a contest. I’m not going to be a hypocrite and tell you not to do this. I do it all of the time. It’s fun, and it’s a good way to open my eyes to lineup combinations that I may not have considered otherwise.
Where sim hacking gets dangerous is when you become obsessed with finding and only considering the very best simulating lineups. Our analysis throughout this article has shown, at least historically, that:
- The sim does a good job of distinguishing between bad and good lineups.
- The sim does an okay job of distinguishing between good and very good lineups.
- The sim loses some signal when trying to distinguish between very good lineups and the absolute best lineups.
We see this with the lack of calibration on outlier high simulated cash rates, and we see this with actual average ROIs remaining flat (strong, but flat!) among the top three simulated ROI buckets.
If we focus on only finding the very best simulating lineups by backing into what the sims like, we end up narrowing our considered lineups at the behest of false precision. It also becomes easier to fall prey to rank order bias. You may have whittled down to 100 lineups to test pre-lock that all simulate with at least a 40% ROI. Assuming you don’t predict a big drop-off in post-lock ROI for these lineups due to an ownership miss, they’re all perfectly viable. Yet, when we see them in a list, sorted by ROI, it becomes easy to dismiss a slew of viable lineups that end up in the latter half of that list.
It’s Okay to IKB the ETR Projections
If you’re unfamiliar with IKB, it stands for “I Know Better.” In other words, there are going to be times you disagree with an ETR projection for a variety of potential reasons. The question is how to best incorporate these IKBs into your process.
People often complain or excuse their lineups simulating negatively post-lock because “of course my team didn’t sim well in ETR post-lock, ETR had X player for only Y points, which was obviously wrong.” If this is consistently happening to you, you’re probably going to lose over the long run. We know the ETR sims are pretty well calibrated and good at identifying bad teams. Now, if you’re able to spot the correct side of the ETR projection miss at a very high rate, this might not be true. But most people are going to be closer to 50/50 on this.
This is not to say that you shouldn’t incorporate IKBs into your process. The ETR projections are going to be wrong at times. (For clarification, by “wrong” in this instance, we mean that if you were to replay the slate 100,000 times, the mean result of the player would be relevantly higher or lower than our projection.) There are also instances that our projections are “right” but our distributions are slightly off on the tails due to a particularly volatile situation (like the Seahawks’ DST against a first-time QB).
You can definitely take advantage of this, but you probably want it to be a freeroll. What I mean by this is you still want to find a lineup that sims well with the base ETR projections. But within the lineups you create that sim well on a given week, there’s flexibility in determining the ones you actually want to play.
There are two ways to do this:
One, you can simply scroll through the list of lineups you’ve saved and find the combination that feels best to you — avoids the players you think ETR is too high on and incorporates a player you think ETR is too low on.
Say I have this list of Brock Purdy stacks with Derrick Henry, a combination I know I want to play, but I also think ETR is way too high on Harold Fannin Jr. and low on the Saints’ defense:
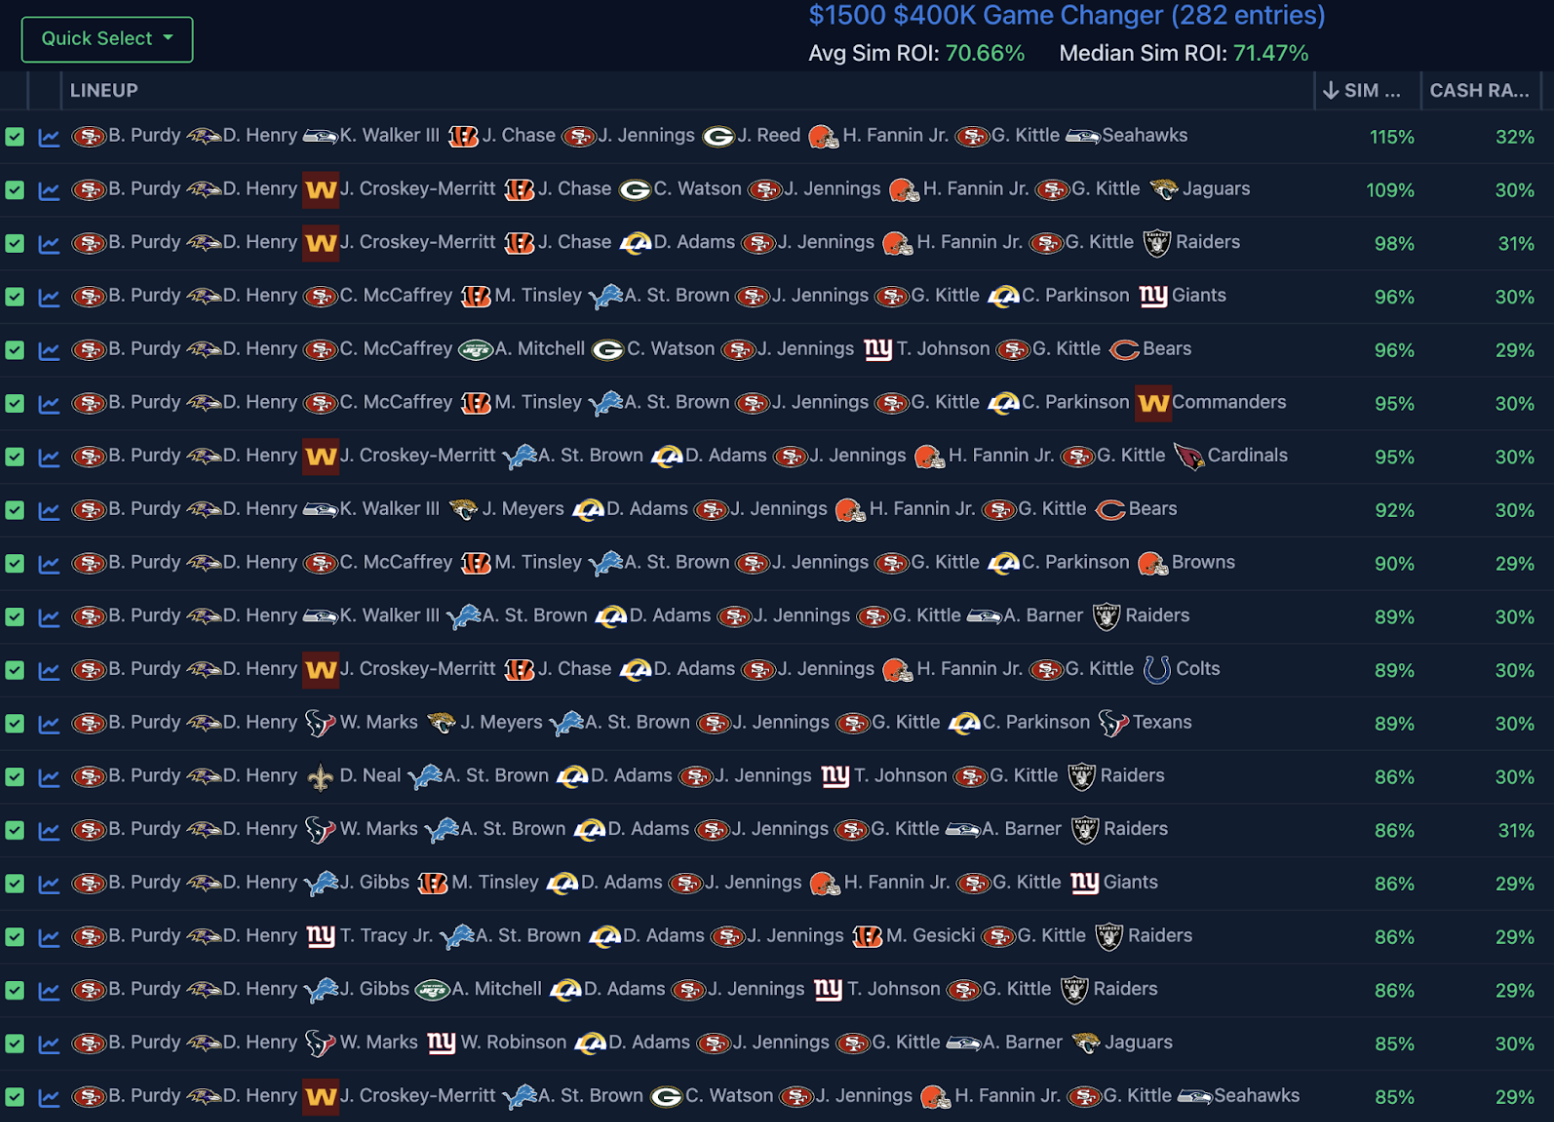
It’s okay to filter onto combinations with the Saints’ defense and play the well-simulating teams that don’t include Fannin, even though they appear lower on the list and have a lower (but still strong!) ROI:
There are pros and cons to both methodologies. The first method is quicker and is less likely to provide you with a false sense of confidence. The second method can be useful in understanding the leeway on ETR’s projection miss. For example, maybe you think ETR is too high on Fannin for the week, but after putting in a projection 1.5 points lower, he still simulates well. In that instance, you might be okay playing him regardless.
In general, I try not to alter the projections of more than 10 players on a given week, and I try to keep those projection edits in the 1-2 point change range.
As an aside, I think there’s a particular advantage to IKBing a set of correlated players. Part of the reason I don’t like playing negatively- or neutral-simming ROI lineups is that I often have to be on the right side of an IKB on multiple players in the lineup for that lineup to become a good lineup. However, if 3-4 players are tied together by the same thread, you really only have to get one IKB right; it just happens to affect multiple players when doing so. If you ever see me play a lineup that doesn’t sim well pre-lock, it’s probably an instance like this where one correct assumption (this team throws and scores more) impacts multiple players simultaneously, allowing for a neutral-simulating team to quickly become a positive-simulating one.
Diversification is a good tiebreaker
If I’m playing three different small-field tournaments in a week, it’s often tough to know how to divvy up those lineups, especially if I’ve fallen into the sim hacking trap. When sim hacking, the same patterns routinely will exist in the very best simulating lineups. We have to remember that these lineups aren’t that much better than a more typical good simulating lineup. Otherwise, we may feel overly compelled to make sure that pattern exists in all three of our small-field lineups on the week.
Personally, I’m less worried about perceived safety and having heavy overlap so that “if I’m right” all of my lineups do well. I’m more focused on creating multiple strong paths to a potential bink, even if that makes my sweat muddier or riskier.
There’s still room to be concentrated on specific players or fades if you think that is the best route to winning on a given week. The key is to find your edge and diversify around it.
To summarize my personal approach:
- Find lineups above a minimum threshold of pre-lock ROI (or whatever metric you choose to use). We know good lineups are good, average are average, and bad are bad. But our ability to further break down the good lineups into solid, good, very good, and optimal is less clear.
- Further filter down a set of lineups by making ownership adjustments for your specific contest. Keep the lineups that are robust to potential projected ownership misses. We know lineups that sim well pre-lock are going to sim well post-lock as long as ownership is roughly around where we expect it to be.
- Either directly adjust simulated projections based on your feelings or pick and choose lineups you like best from the remaining set. Don’t get obsessed with the specific simulated ROIs or ROI ranks of these remaining lineups.
- When in doubt and playing multiple lineups, diversify.