In 2018, RotoViz’s Blair Andrews wrote one of my favorite fantasy football articles ever. In it, he compares FantasyPros Expert Consensus rankings to ADP to determine whether fantasy analysts are better than the market at picking the right players. His conclusion:
As it is, we can find an edge in one of two places. The first place to look for an edge is to try to get closer to reality than everyone else — that is, to be better at making predictions than everyone else. We’ve already seen that even experts fail to do this consistently.
The second way to find an edge is on the perception side, namely, to recognize systematic ways in which our perceptions tend to go wrong — in which ADP tends to go wrong. We might not be able to make better predictions than ADP, but if we can recognize systematic ways in which ADP tends to go wrong — the types of players that ADP tends to get wrong — then we can exploit those inefficiencies without needing to make better predictions. At least, that’s what I’m hoping to do in future installments.
The fantasy industry has gotten better in all facets since 2018: player selection, roster construction, and everything in between. But the idea remains that it’s hard to pinpoint which players the market is valuing incorrectly (although it’s almost certainly easier than it seems by just comparing ECR to ADP since the former includes every analyst tracked on FantasyPros). In fact, you could argue it’s more difficult to choose the right players nowadays since the market theoretically becomes sharper each year as more data/analysis becomes available. That leads us to the final paragraph in Blair’s article, which indicates that the best way to beat the market is to find the types of players ADP gets wrong.
One of those systemic inefficiencies is/was the “running back dead zone” — which refers to how running backs in Rounds 3-6 (rough approximation, not a hard cutoff) have underperformed ADP. Conversely, wide receivers in that range have consistently beaten market-implied expectations. With that being said, the idea of a continuously sharpening market applies to these here as well. Best ball ADP has shifted this year, dramatically so on some sites (looking at you, Underdog). Today, we’ll recap running back dead zone data from 2022 and dive into current ADP on both Underdog and FFPC to determine whether the market has corrected for this inefficiency.
THE HISTORY OF THE DEAD ZONE
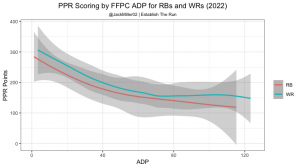
Examining historical data illustrates why the concept of a running back dead zone has become so popular. As you can see in the graph below, PPR RB scoring from 2017-21 declined relatively sharply early in drafts (using FFPC ADP) before leveling off for the rest of the single-digit rounds. In contrast, WR scoring was fairly flat for the first ~5-6 rounds before suddenly falling off. Rounds 3-6 were also the area in which we saw the greatest difference between the two positions. The difference between the two positions was smallest in Rounds 7-10, indicating that was the optimal time to draft running backs. Player win-rate data agreed with this, as RBs in those late single-digit rounds typically posted above-average win rates, while WRs suffered.
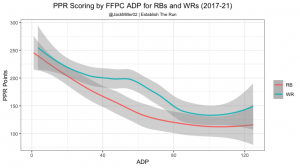
It’s also worth mentioning that WRs score more raw PPR fantasy points than RBs at all points in the first 10 rounds (and this is still true). FFPC rules only mandate that each team starts two receivers each week, but they have two flex spots as well. Since WRs score more points, you are donating points if you aren’t drafting as if you’ll start four WRs each week. The plot above demonstrates that a WR drafted around pick 50 scored around as much as an RB drafted 20th overall between 2017-21.
This isn’t to say that you’ll never start a running back in one or both of your flex spots during the best ball season, but it’s optimal to draft as if you’re starting four WRs. Combine that with the knowledge that WR scoring tanks after Round 6 while RB scoring in Round 5 is comparable to what you can get in Round 10, and the RB dead zone was born.
HOW THE MARKET HAS CHANGED OVER TIME
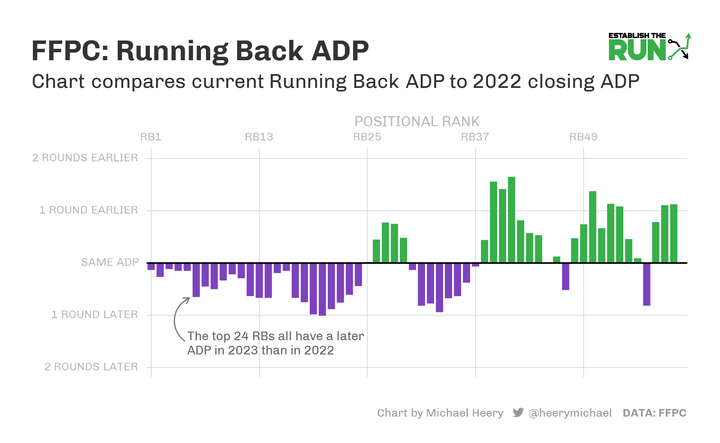
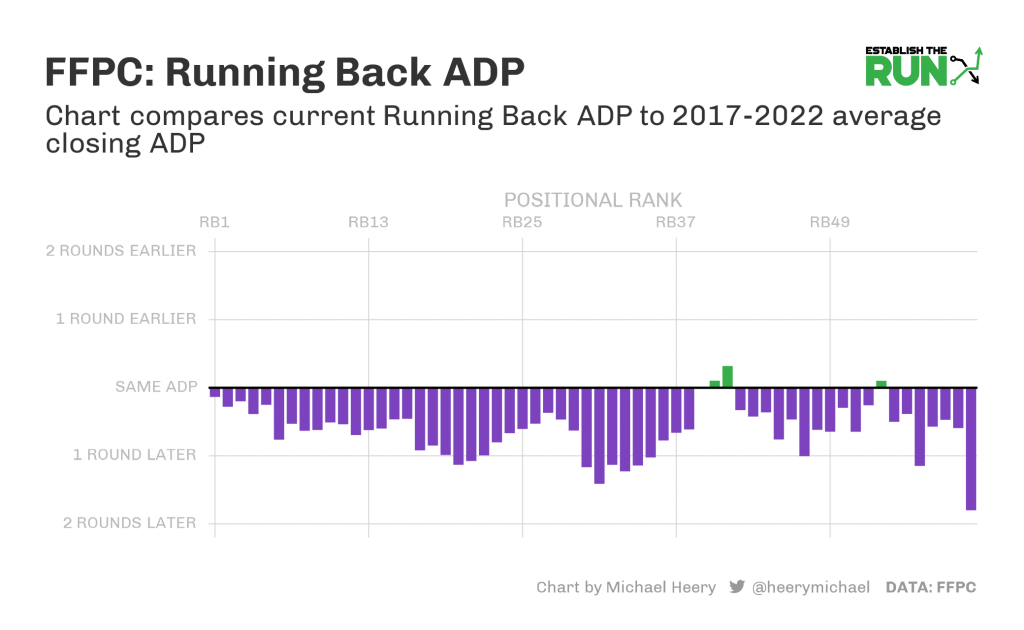
However, the market gets sharper over time, and best ball drafters have started to correct the previously inflated RB ADPs over the past two seasons. Last year, starting around RB13 and continuing into RB3 territory (which is historically the group that has gone in Rounds 3-6), running backs went approximately six picks later than usual on FFPC. That trend has continued this offseason as RB ADP continues to torpedo. Positionally, the RB dead zone usually starts in low-end RB1 territory and runs into high-end RB3s. You can see below how that group is going around eight spots later than last year on average.
The dramatic ADP shift becomes even more apparent when you compare current FFPC ADP to an aggregate of 2017-22. RBs in the general dead zone range are falling as much as an entire round past where they went in past seasons.
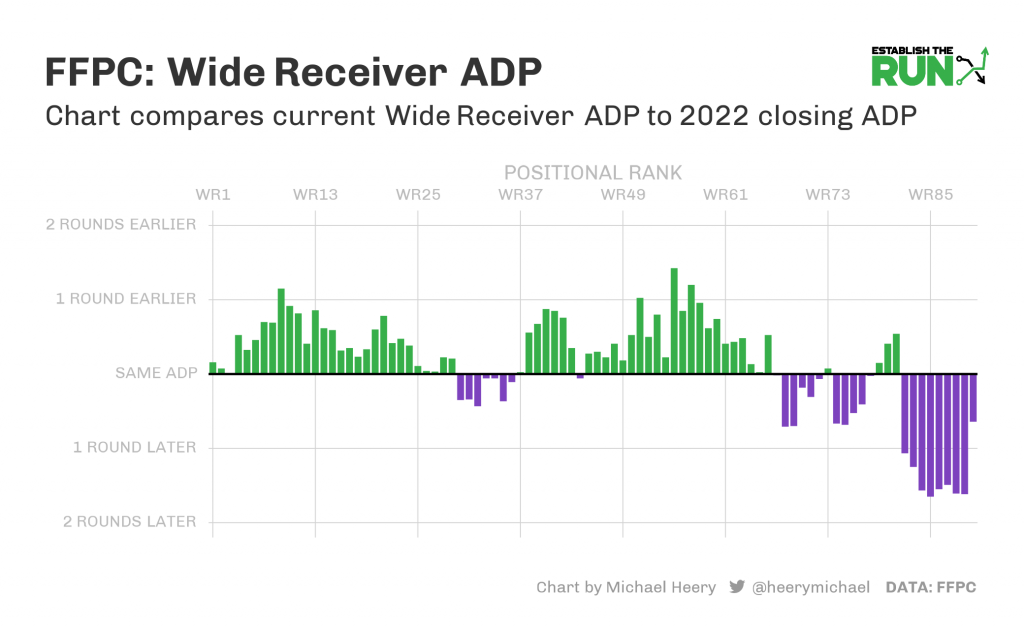
Wide receivers, on the other hand, are being drafted significantly earlier than in previous years.
WHAT HAPPENED IN 2022?
This becomes particularly interesting when you look at the scoring graph for 2022, which shows that we didn’t see a dead zone last year as we did in previous seasons. It’s worth noting that RBs in the dead zone were not better investments than WRs; if that were the case, Rounds 3-6 would be the smallest gap between the two lines. However, last year was the first time in which the two positions have been basically equal investments in those rounds.
If there was no ADP change, we could pretty easily brush this aside as a one-year aberration in an otherwise spotless trend and continue drafting WRs in Rounds 3-6. But the market is changing, and there is an equilibrium at some point at which it becomes at least okay to draft RBs in these rounds.
With that being said, we can’t just see that ADP has shifted and automatically declare that the dead zone is — no pun intended — dead. The table below shows that 2022 was a stellar year for the RB cluster that typically goes in the dead zone, as their 193.8 PPR average was second best in the past six seasons. Scoring for WR10-25 (coincidentally also a good rough approximation for which WRs have historically gone in Rounds 3-6) was also slightly down.
| Year | RB10-25 Mean PPR Points | WR10-25 Mean PPR Points |
|---|---|---|
| 2017 | 178.4 | 188.2 |
| 2018 | 150.9 | 195.8 |
| 2019 | 203.3 | 204.1 |
| 2020 | 163.2 | 210.6 |
| 2021 | 186.3 | 214.8 |
| 2017-21 Average | 176.4 | 202.7 |
| 2022 | 193.8 | 197.3 |
Running backs with an ADP in Rounds 3-6 averaged an 8.4% win rate on FFPC last year. Dead-zone WRs fell just short of that with an 8.3% figure. If the market was the same as last year, I would be inclined to continue to almost exclusively draft WRs in these rounds because it was a measurably above-average year for the group of RBs in this range and a slightly below-average year for the receivers (which is probably mostly just variance), and still the two positions were practically equal value investments. However, the market has changed — we showed earlie
We've created the best Draft Kit on the internet.
Our fantasy football Draft Kit Pro was created to prepare you with the highest-quality resources to help you win your league.
Our team of analysts, led by Evan Silva and Adam Levitan, create unmatched content and rankings to make sure you’re ready for draft day. While our Draft Kit is built for competitive fantasy players, we’ve made it fun and easy to consume.
If you aren’t satisfied with our Draft Kit for any reason, just email us within 48 hours of purchase and we’ll provide a full refund.
Full Draft Kit Overview » Already a subscriber? Log In