Running back is a position we recommend fading in the early portions of dynasty startups, but it can be a great position to spend on in rookie drafts. They can often hit early and ascend to the top portions of their position ranks at a relative discount — it is probably the cheapest way to acquire potentially multiple years of RB production. Let’s take a look at what you should be looking for in RB prospects, as well as some relevant pieces of information to know for our prospect profiles.
Draft Position
Much like wide receiver, we want to be sure to pay attention to draft position when evaluating RBs. 33% of all RB1 seasons (PPG, min 8 games played) since 2012 came from first-round players, and 75% of such seasons belonged to players selected in the first three rounds.
Perhaps most importantly, repeat performers were most often early draft picks. A very nice 69% of RB1s selected in Rounds 1-3 in the sample had at least one other RB1 season within the timeframe (1.3 additional RB1 seasons on average). Only 23% of Day 3 or undrafted players repeated (0.4 additional RB1 seasons on average). This is critical for dynasty.
Using our database of RB prospects dating back to 2005, we can see how often players succeeded at the NFL level. If we consider a “hit” to be a prospect to average at least 15 PPR points per game within three seasons, these are the respective hit rates by round.
Round 1 — 67%
Round 2 — 32%
Round 3 — 20%
Round 4 — 5%
Round 5 — 5%
Round 6 — 6%
Round 7 — 6%
Undrafted — 2%
It is easy to see why these early-round hit rates are elevated when compared to the WR position. Volume drives fantasy scoring, but acquiring WR volume is ultimately a skill. RBs don’t have to get open in order to receive a handoff, and players drafted early are more likely to be entrenched in positions to see the ball early and often. We absolutely need to be considering draft capital when looking at who to select in rookie drafts.
Age and Experience
On the surface, it appears that the age of RB prospects matters a great deal. Here is hit rate by the final age of the prospect (marked on December 31 of his final season).
20 Years Old — 33%
21 Years Old — 11%
22 Years Old — 7%
23 Years Old — 4%
All Other Ages — 0%
Unfortunately (or fortunately, I suppose, depending on your perspective), this all seems to be baked into draft position. Here are the hit rates by age for top-100 picks only.
20 Years Old — 49%
21 Years Old — 29%
22 Years Old — 41%
23 Years Old — 25%
All Other Ages — 0%
The signal is completely gone once we factor in when the player was drafted. A similar relationship exists for experience, but I will not post it here to avoid clogging up the piece.
Breakouts
While age and experience do not yield much of a return, we still see value in observing breakouts at the RB position. The statistic to note for RB breakouts is adjusted yards per play — something simple I created that tells us the yards contributed by the player per play, with a 2x multiplier given to receiving. Simply put, it makes sense to weigh receiving more because it matters more for fantasy, and this bears out in statistical testing.
For a RB season to qualify as a breakout, he must post an adjusted yards per play of at least 2.0. Breakouts proved to be significant. 18% of all RB prospects in the database who broke out were hits, versus just 5% of all other prospects. Even if we restrict the sample to only top-100 draft picks, breakouts hit a whopping 40% of the time, while non-breakouts hit at a 26% clip.
The power of breakouts is enhanced when we look at when the breakout occurred. There are three distinct groups that can be formed whether we are looking at age or experience. Let’s look at age first.
Broke out at 18 or 19 — 46% (75% for top-100 picks)
Any other breakout — 13% (31% for top-100 picks)
No breakout — 5% (26% for top-100 picks)
The results are similar if looking at experience.
Broke out in Year 1 or 2 — 32% (53% for top-100 picks)
Any other breakout — 12% (32% for top-100 picks)
No breakout — 5% (26% for top-100 picks)
The hit rate for the very top group is more pronounced when looking at age, but it is worth noting that the sample when looking at experience is roughly twice as big.
Athletic Testing
Unlike WRs, athletic testing can be valuable in determining who will succeed or fail at the RB position. To give a nice visual on breaking out large data sets, sometimes I like to use classification trees. The data points look like the following.
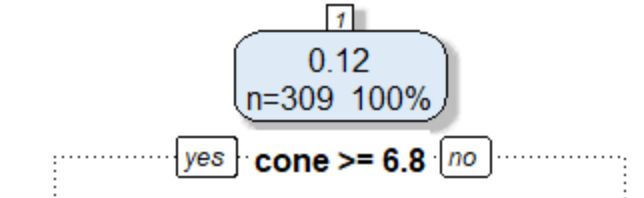
The number on top represents the success rate in the sample as a decimal (12% pictured above). The value of n is the number of items that fits each grouping, while the percentage to the right of it gives n as a percentage of the overall sample. Then there will be a branch off based on some kind of criteria. Pictured above is a three-cone time higher than or equal to 6.8 seconds. If a prospect fits that description, we travel left; if he doesn’t, travel right.
The full (small) tree for athletic testing in RBs is pictured below. I used 309 RBs in our dataset from 2005 to 2019 that we had full athletic testing measurables for. The objective was to find RBs who reached 15 or more PPR points within their first three years, as above.
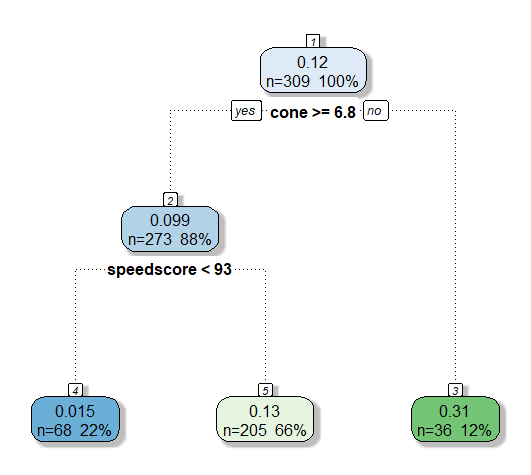
The tree is excellent because it gives us both something to shoot for, and something to avoid. We can see that RB prospects who had a three-cone better than 6.8 seconds were incredibly likely to succeed, with a hit rate of 31% (the program actually does a bit of rounding, so better than 6.85 to be more exact).
For prospects without this three-cone benchmark, there is a threshold that can be considered a pre-requisite based on speed score. For those who don’t know, the speed score calculation is (weight*200)/forty^4. If a RB prospect does not have a speed score of at least 93, it is highly unlikely that he will find success. Our sample hit rate was just 1.5% for backs failing to meet that mark.
This holds up when looking at the best fantasy RBs in football over the past decade. Of the 46 unique RB1s from 2012 to 2021, only three failed to meet both the three-cone and speed score thresholds: Darren Sproles, Justin Forsett, and Theo Riddick. All three only accomplished the feat just once.
Statistics Glossary
You may see a variety of statistics referenced in our upcoming RB profiles. Here is the skinny on the most common ones you will see, along with abbreviations you may see for those stats.
Receiving Yards Per Team Pass Attempt (rec_yd_pta) — The average number of receiving yards a player is responsible for per team pass attempt. This is useful for measuring both the receiving volume a RB may receive, as well as his efficiency, and would benefit RBs who see targets out wide and deeper down the field. This statistic is valuable in finding comparable RBs.
Adjusted Yards Per Play (adj_ypp) — Yards contributed by the player per play, with a 2x multiplier given to receiving. This is beneficial for RBs as it emphasizes the part of their game that will be more valuable for fantasy. Only includes games in which he participated. This statistic is valuable in finding comparable RBs.
Yards Per Carry (rush_avg) — Self-explanatory, but important for evaluating the RB position. Note that career yards per carry (c_rush_avg) is valuable in finding comparable RBs.
Yards Per Reception (rec_avg) — Self-explanatory, but important for evaluating the RB position. Note that career yards per reception (c_rec_avg) is valuable in finding comparable RBs.
Breakout Year (byear) — The year of a player’s career that a RB broke out. Note that this is taken as the number of seasons since high school graduation, and would include any redshirt seasons. This statistic is valuable in finding comparable RBs. Breakout year defaults to the final year of the player’s career if he did not break out.
Breakout Age (bage) — The age of a RB in the season of his breakout. Note that this is taken on December 31 of said season. This statistic is valuable in finding comparable RBs. Breakout age defaults to the player’s final age if he did not break out.