

Earlier this offseason, Mike Leone published a data-driven piece on The Solver’s NFL Classic sims, providing a meticulous deep dive into whether the post-lock simulations actually predict real-world outcomes. Using two seasons’ worth of Game Changer data, Leone found that the sims were well-calibrated; lineups that sim positively at lock cash more often, finish in the top 10 more often, and produce better actual ROI than their negatively-simming counterparts. Leone was able to separate the signal from DFS noise and find actionable takeaways from the post-lock sims that we can all apply in our pre-lock lineup construction process.
I entered the doldrums of the NFL offseason with a similar goal, applied to a much different dataset. The question was simple: Do the sims work the same way in NFL showdown as they do in classic?
To find out, I gathered all available post-lock sims data from The Solver’s showdown contests, specifically focused on both the Wildcat ($333 buy-in) and Field General ($444 buy-in), for every week we had that data and ETR projection data. The resulting dataset: 49,146 total lineups across 33 different slates, from Week 5 through the Super Bowl. For every lineup reviewed, we can see all of the relevant post-lock sim data (ROI, cash rate, top-1% rate, etc.), along with the actual contest result (lineup rank, money won) and a full construction breakdown (CPT position, roster construction, salary used, duplicates, projected ownership, etc.) thanks to the ETR projection data.
There are a few important distinctions worth pointing out: While this dataset covers 33 different slates, that is still a remarkably small sample. Additionally, this is a very different contest than the one Leone covered, featuring a larger field, lower buy-in, and multi-entry vs. single-entry status. Some of the things Leone unearthed through his review of the classic post-lock sims will hold up for showdown, and others won’t. We’ll start by asking whether the sims are actually calibrated, what that means for our bankroll, and wrap up by identifying practical construction principles we can apply once the 2026 season gets underway.
Before we dive specifically into our showdown post-lock sims, it’s important to review Leone’s article to understand what our sims do and don’t account for. With that serving as a baseline for our analysis, let’s start by determining whether or not the sims correctly distribute the cash probability across individual lineups. If the sims say a lineup has a 30% cash rate, does that lineup actually cash more often than one the sims have at 15%?
We bucketed all 49,146 lineups by their sim cash rate and compared it to how often lineups in that bucket actually cashed:
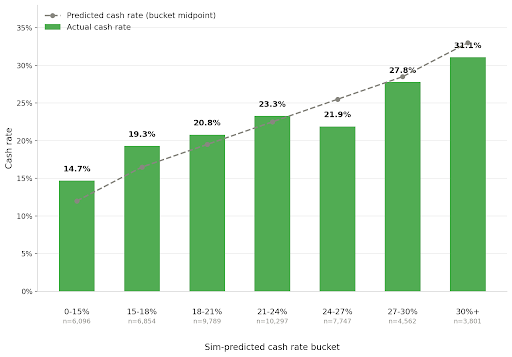
As predicted cash rate increased, actual cash rate increased as well. For example, lineups in the 18-21% sim cash rate bucket cashed 20.8% of the time, while lineups that were predicted to cash at a 30+% clip cashed 31.1% of the time. The sims’ cash rate is a reliable signal; a lineup predicted to cash more often than another lineup does, in fact, cash more often.
Do the Sims Pick Winners?
We create the highest-quality NFL content
Our team includes renowned fantasy analysts Evan Silva and Adam Levitan, high-stakes professional DFS players, and specialists who cover niche areas that we believe are important to understand.
We don’t sell lineups or claim to have all of the answers. We do analyze what’s happening in a way that’s digestible and actionable, to prepare you to make the best decisions possible during the 2026 NFL season.
To read this content, you’ll need our NFL In-Season package.
Full Details! » Already a subscriber? Log In